Cuban Journal of Forest Sciences. 2022; september-december 10(3): 278-291![]()
Translated from the original in spanish
Original article
Dynamics of change in urban and peri-urban ecosystems in the metropolitan area of Monterrey, Mexico
Dinámica de cambio en ecosistemas urbanos y periurbanos en el área metropolitana de Monterrey, México
Dinâmica de mudança nos ecossistemas urbanos e peri-urbanos na área metropolitana de Monterrey, México
Javier Jiménez Pérez1*![]() https://orcid.org/0000-0003-4246-7613
https://orcid.org/0000-0003-4246-7613
Rufino Sandoval García1![]() https://orcid.org/0000-0003-4448-6172
https://orcid.org/0000-0003-4448-6172
Eduardo Alanís Rodríguez1![]() https://orcid.org/0000-0001-6294-4275
https://orcid.org/0000-0001-6294-4275
José Israel Yerena Yamallel1![]() https://orcid.org/0000-0002-9216-7427
https://orcid.org/0000-0002-9216-7427
Oscar Alberto Aguirre
Calderón1![]() https://orcid.org/0000-0001-5668-8869
https://orcid.org/0000-0001-5668-8869
1Faculty of Forest Sciences of the Autonomous University of Nuevo León. Mexico.![]()
*Corresponding author: jjimenez20@gmail.com
Received:2022-03-31
Approved:2022-09-02
ABSTRACT
The loss of forest ecosystems due to urbanization has numerous impacts on environmental and social services, which is why a detailed monitoring system for the fragmentation process of the two ecosystems is necessary. The objective of this research was to determine the rate of change in land use and the availability of urban and peri-urban ecosystems in the metropolitan area of Monterrey, Mexico. A multi-temporal analysis was carried out in QGIS 2.18.25, by means of a supervised classification of high-resolution satellite images from 1994 to 2020, and the availability of green areas per inhabitant (m-2 inhab-1) was obtained from the surface of the urban ecosystems and population growth by municipality. The results indicate that over a 26-year period, the Monterrey metropolitan area lost 33% of two urban ecosystems and 13 % of two peri-urban ones, at an average rate of -1.53 and -0.93, respectively. The availability of green areas per inhabitant increased from 68 to 32 m-2 inhab-1 and the trend indicates that in less than ten years some municipalities will have only 15 m -2 inhab -1. For that reason, it would be necessary to prioritize strategies of ecological restoration to regulate microclimatic conditions, mitigate the impacts of heat islands and maintain the provision of environmental services that these ecosystems provide to the Monterrey metropolitan area.
Keywords: Green areas; Heat islands; High resolution satellite images; SASPlanet and Ecosystem Services.
RESUMEN
La pérdida de ecosistemas forestales por la urbanización tiene innumerables impactos en los servicios ambientales y sociales, por lo cual, se requiere de un sistema de monitoreo detallado del proceso de fragmentación de ecosistemas. El objetivo de la presente investigación fue determinar la tasa de cambio del uso del suelo y la disponibilidad de ecosistemas urbanos y periurbanos en área metropolitana de Monterrey, México. Se realizó un análisis multitemporal en QGIS 2.18.25, mediante una clasificación supervisada de imágenes satelitales de alta resolución de año 1994 al 2020 y la disponibilidad de áreas verdes por habitante (m-2 hab-1) se obtuvo de la superficie de los ecosistemas urbanos y crecimiento poblacional por municipio. Los resultados indican que en un periodo de 26 años el área metropolitana de Monterrey ha perdido el 33 % de ecosistemas urbanos y 13 % de periurbanos, a una tasa promedio de -1.53 y - 0.93 respectivamente. La disponibilidad de áreas verdes por habitantes pasó de 68 a 32 m-2 hab-1 y la tendencia indica que en menos de diez años algunos municipios dispondrán únicamente de 15 m-2 hab-1, por lo que se requieren la priorización de estrategias de restauración ecológica para regular las condiciones microclimáticas, mitigar los impactos de las islas de calor y mantener la provisión de servicios ambientales que brindan estos ecosistemas al área metropolitana de Monterrey.
Palabras clave: Áreas verdes; Imágenes satelitales de alta resolución; Islas de calor; SASPlanet y Servicios ecosistémicos.
RESUMO
A perda de ecossistemas florestais devido à urbanização tem inúmeros impactos nos serviços ambientais e sociais, razão pela qual é necessário um sistema de monitoramento detalhado do processo de fragmentação dos ecossistemas. O objetivo desta pesquisa foi determinar a taxa de mudança do uso da terra e a disponibilidade de ecossistemas urbanos e periurbanos na área metropolitana de Monterrey, México. Uma análise multitemporal foi realizada no QGIS 2.18.25, por meio de uma classificação supervisionada de imagens de satélite de alta resolução de 1994 a 2020, e a disponibilidade de áreas verdes por habitante (m-2 hab-1) foi obtida da superfície de os ecossistemas, crescimento urbano e populacional por município. Os resultados indicam que em um período de 26 anos, a área metropolitana de Monterrey perdeu 33% dos ecossistemas urbanos e 13 % dos periurbanos, a uma taxa média de -1,53 e -0,93, respectivamente. A disponibilidade de áreas verdes por habitante passou de 68 para 32 m-2 hab-1 e a tendência indica que em menos de dez anos alguns municípios terão apenas 15 m-2 hab-1, razão pela qual é necessária a priorização de estratégias. de restauração ecológica para regular as condições microclimáticas, mitigar os impactos das ilhas de calor e manter a prestação de serviços ambientais que esses ecossistemas prestam à área metropolitana de Monterrey.
Palavras chave: Áreas verdes; ilhas de calor; imagens de satélite de alta resolução; SASPlanet e Serviços de ecossistemas.
INTRODUCTION
The elimination of forest cover, for the establishment of human settlements, infrastructure, industry and shopping centers, has reduced the availability of urban and peri-urban ecosystems at an accelerated speed. Those factors have modified the natural processes of runoff and increases the risk of flooding, it reduces the recharge of aquifers, loss of biodiversity and degradation of ecosystems (MacGregor-Fors et al., 2009).
Urban ecosystems (green areas) are a set of natural resources that include: water, soil, landscapes, agricultural areas, forests, gardens and associated organisms, which generate a microclimate in cities, contribute to reducing the effect of heat islands by reducing the flow of sensible heat and air temperature due to plant transpiration (Meza and Moncada, 2010).
They improve air quality by filtering polluting particles, insulate noise, sequestrate carbon, protect the soil against erosion, control solar radiation, provide wildlife with shelter and generate a positive psychological effect that improves physical and mental health of residents (Nowak et al., 2006).
Urban developers, forestry experts, politicians, residents and environmentalists are responsible for the establishment and maintenance of green areas; however, they are not always accepted or considered during planning because they compromise spaces for capitalist development (Bascuñán et al., 2009).
In order to make decisions in the planning of urban areas and prioritization of critical areas where to implement ecological restoration strategies and landscaping practices, it is essential to have a monitoring system that allows understanding the process of loss and fragmentation of green areas (Giri et al., 2007).
Satellite images have become a tool with high potential and importance for multi-temporal monitoring of forest ecosystems and the growth of large cities (Ardila et al., 2012). Due to the high level of detail with which natural resources can be observed, the use of high-resolution images (30 cm at 5 m/pixel) greatly improves the interpretation of the different land use change scenarios (Everitt et al., 2007).
Through multi-temporal analyzes with these images, it is possible to obtain a real picture of the loss of urban and peri-urban ecosystems, with spatially explicit and statistically representative information from individual trees or groups (Azzari et al., 2017).
The objective of this research was to determine the rate of land use change and the availability of urban and peri-urban ecosystems in the metropolitan area of Monterrey, Mexico, to identify and prioritize critical areas for ecological restoration and urban planning. The proposed hypothesis indicates that population growth affects the loss of urban and peri-urban ecosystems in the metropolitan area of Monterrey.
MATERIALS AND METHODS
Location of area of study
This study was conducted in the metropolitan area of Monterrey, Mexico, contemplating seven municipalities: General Escobedo, Guadalupe, Monterrey, San Nicolás de los Garza, San Pedro Garza García, Santa Catarina, and Apodaca (Figure 1).
The municipalities as a whole have a total population of 7,549,298 inhabitants, in an area of 60,296.76 hectares (ha), where industrial parks and shopping centers are concentrated and the main economy of northern Mexico is developed.
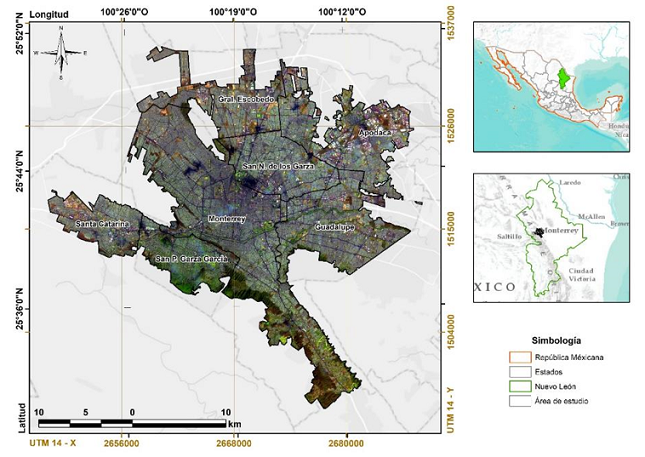
Figure 1. - Location of the metropolitan area of Monterrey, Mexico
Processing and generation of orthomosaics
The Landsat 8 (30 m/pixel, Figure 2A) and Sentinel 2 (10 m/pixel, Figure 2B) satellite images present a bias in the calculation of surfaces. For that reason, a comparison was made with orthophotos (1 m/ pixel; Figure 2C) and Birdseye images (0.28 m/pixel; Figure 2D), which are considered high resolution.
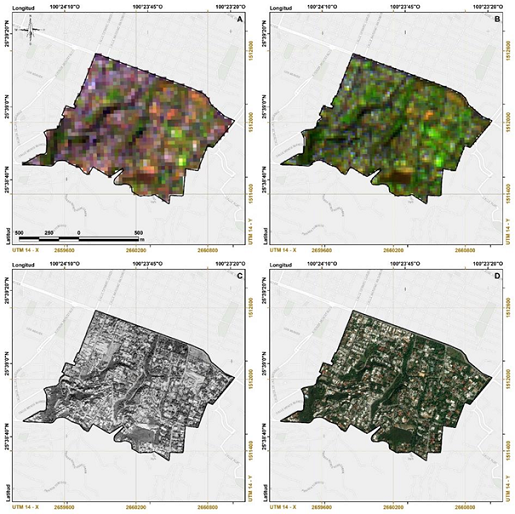
Figure 2. - Comparison of Landsat (A), Sentinel (B), Orthophoto (C) and Birdseye (D) images
Four orthomosaics composed of 9 orthophotos, (1.5 m/pixel; year 1994, Figure 3A), 31 orthophotos (1 m/pixel; year 2004, Figure 3B), 48 of Airbus Defense and Space (1.14 m/pixel; year 2020, Figure 3C) and 193 Birdseye images (0.28 m/pixel; year 2010; Figure 3D), were processed and generated.
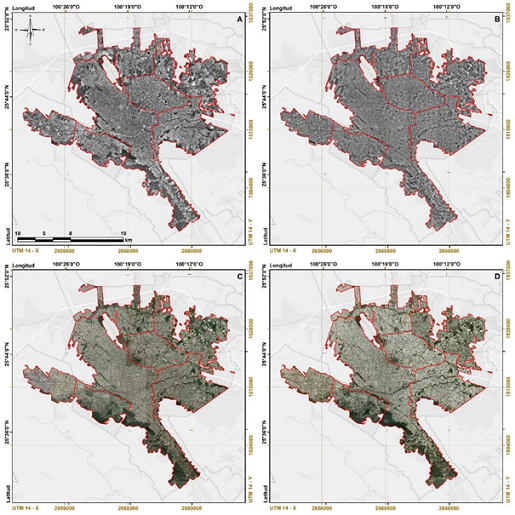
Figure 3. - Orthomosaics of the year 1994 (A), 2004 (B), 2010 (C) and 2020 (D)
The Landsat and Sentinel images were obtained from the free access platforms Earth Explorer of the United States Geological Survey (USGS, 2021). The orthophotos of Space and Mexico Data of the National Institute of Statistics and Geography; as well as the images of Airbus Defense and Space and Birdseye of the SASPlanet software.
Supervised classification
For the detection of changes, the open source software QGIS 2.18.25 "Las Palmas" was used, since it is the most stable version. An atmospheric correction was made to the images of each year, which were cropped and subjected to an unsupervised classification process with the "K-means analysis" module that groups the cell values into classes, with the analysis method of multivariate data clusters (Rashmi et al., 2016).
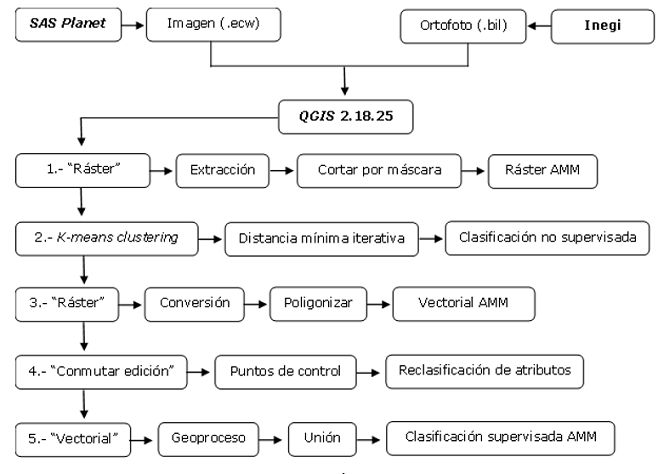
Figure 4. - Supervised classification process in QGIS 2.18.25
Subsequently, the files were transformed from raster to vectorial format, for a supervised classification (Figure 4), through control points with information obtained in the field (Figure 5), in 100 sites distributed in a systematic way, in areas with a high degree of confusion by the reflectance of the images, exposure, noise and cloudiness (Jumb et al., 2014).
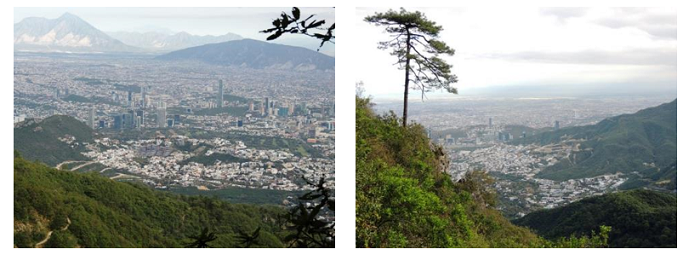
Figure 5. - Urban and peri-urban ecosystems of the Monterrey metropolitan area
The agreement and precision of the classification results of the high-resolution satellite images were calculated in the "r.kappa" module in GRASS, which generates an error matrix and determines Cohen's kappa coefficient.
Determination of land use change rate
The determination of the rate of change of land use and vegetation was obtained through the equation adapted by Palacio-Prieto et al. (2004) (Equation 1).
![]()
Where:
![]() = Rate of change expressed as a percentage.
= Rate of change expressed as a percentage.
S1= Surface of date 1.
S2= Surface of date 2.
n= Number of years between the two dates
Determination of green areas per inhabitant
The determination of green areas per inhabitant was calculated using the formula adapted by Ballinas and Barradas (2015), considering only the urban ecosystems and the total population per municipality in the different years, which was obtained from the Territorial Information Consultation System (INEGI). , 2021b) (Equation 2).
![]()
Where:
AV= Green area per inhabitant
(m-2 inhab -1).
Sup= Green area surface
(m-2).
Hab= Number of inhabitants
(inhab-1).
RESULTS AND DISCUSSION
The comparative analysis between satellite images showed that there is an overestimation of more than 38 % with Landsat 8 OLI and 22 % with Sentinel 2A, compared to high resolution images that presented average values of kappa index of 0.82, considered within of a very good level of precision. That is similar to the reports of Arenas et al. (2011) and Mendes et al. (2015) for Quickbird (2.4 m/pixel) and Geoeye-1 (1.65 m/pixel) images.
In the metropolitan area of Monterrey, by the year 2020, a total of 10,657.9 ha of urban ecosystems have been lost, representing 33 % and 13 % of peri-urban ecosystems. Representing an equivalent of 673.8 ha and meaning that the municipalities with the greatest loss are Apodaca with 39.6 %, San Nicolas de los Garza (37.4 %) and Santa Catarina (37.2 %) of the coverage they had in 1994 (Figure 6; Table 1).
Table 1. - Urban and peri-urban ecosystems of the Monterrey metropolitan area
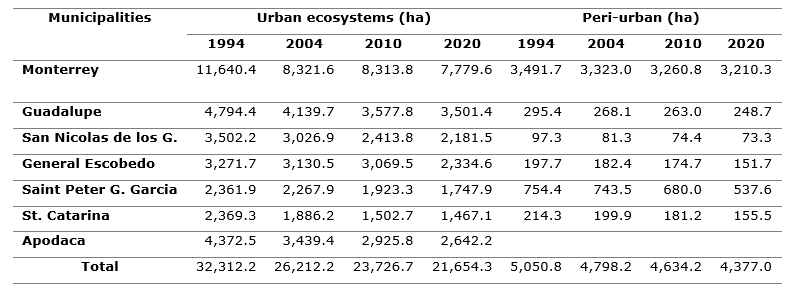
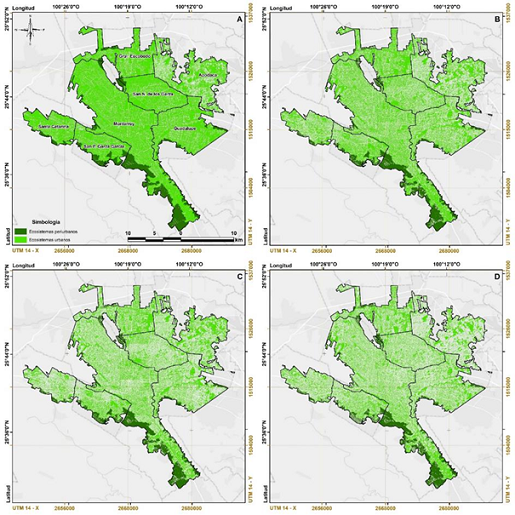
Figure 6. - Urban and peri-urban ecosystems in 1994 (A), 2004 (B), 2010 (C) and 2020 (D)
The availability of green areas per inhabitant in the Monterrey metropolitan area for the year 2020 is 20.1 to 66.1 m-2 inhab-1 (Table 2), which is above the optimal levels, recommending 9 to 15 m-2 inhab-1. The results being similar to those reported in Santiago de Chile and Curitiba, Brazil with values of 26.1 and 51.5 m-2 hab-1 respectively (Mejía and Gómez, 2015), higher than Fuenlabrada, Almería and Reggio di Calabria, Italy with 3 and 4 m-2 inhab-1 and less than Liege, Belgium and Oulu, Finland that have more than 300 m-2 inhab-1 (Fuller and Gastón, 2009).
Table 2. Green areas (m 2) per inhabitant in the metropolitan area of Monterrey
Among the municipalities of the metropolitan area of Monterrey, San Pedro Garza García presents the greatest availability of green areas per inhabitant, due to the fact that population growth has been maintained steadily for more than 30 years on average with 244,336 inhabitants. For that reason it is considered the richest municipality in Mexico and Latin America. Unlike Apoda, that has the lowest availability of green areas per inhabitant as a result of exponential growth, which went from a population of 232,310 in 1990 to 1,313,074 by 2020. The municipality of General Escobedo has a similar situation since went from 196,398 to 962,458 inhabitants (Figure 7).
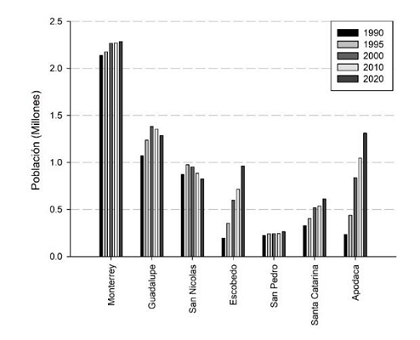
Figure 7. - Population growth of the Monterrey metropolitan area
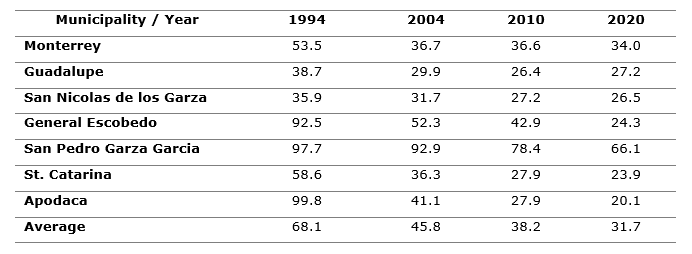
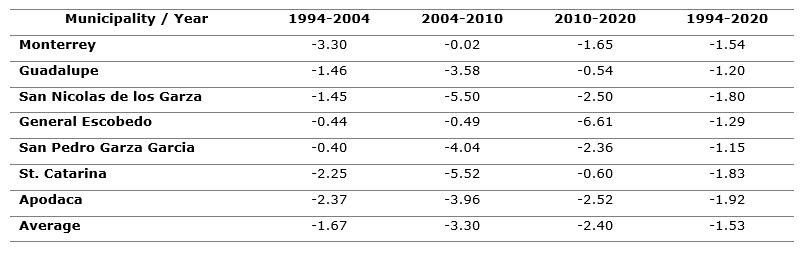
Regarding the municipalities of Guadalupe and San Nicolas de los Garza, they present a negative trend of population growth, as a response to the limited availability of optimal spaces for urban development. In contrast, Monterrey has concentrated the largest population since 1990 with 2,138,501 inhabitants, reaching a maximum growth in 2005 with 2,267,640. Subsequently population growth is minimal, however, it maintains a continuous rate of loss of urban ecosystems and peri-urban (Table 3).
Table 3. - Rate of change of green areas in the metropolitan area of Monterrey
The metropolitan area of Monterrey, in general, presents a gradual trend of loss of urban and peri-urban ecosystems, coupled with the exponential population growth of some municipalities. It is estimated that by the year 2026 the municipality of Apodaca will have 15 m-2 inhab-1. Whereas that will happen for Escobedo in 2031 and for Santa Catarina in 2033 (Figure 8), minimum recommended values, being considered as priority municipalities for the implementation of ecological restoration strategies that allow reversing this process and guaranteeing the life quality of the inhabitants.
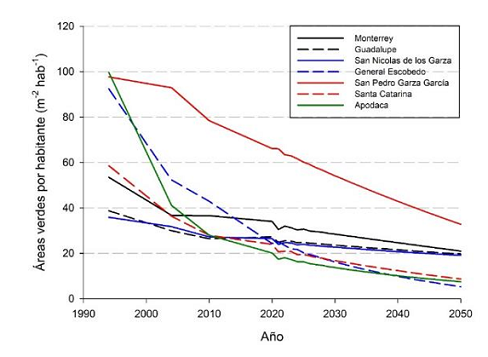
Figure 8. - Projection of loss of green areas in the metropolitan area of Monterrey
CONCLUSIONS
The results of the present investigation indicate that the municipalities of Apodaca, General Escobedo and Santa Catarina, present the greatest loss of green areas, in contrast to those municipalities whose population growth has gradually decreased and included a process of migration towards municipalities and adjoining states.
The rate of change of the urban and peri-urban ecosystems of the Monterrey metropolitan area indicates a negative trend that gradually contributes to the loss of environmental services.
High-resolution images allow identifying priority areas for the implementation of ecological restoration strategies, thus allowing a real panorama of the degradation process of forest ecosystems.
THANKS
To the National Council for Science and Technology, through a postgraduate fellowship awarded to the corresponding author (2018-000068-02NACF-12694).
REFERENCES
ARDILA, J. P., BIJKER, W., TOLPEKIN, V. A. y STEIN, A. 2012. Multitemporal change detection of urban trees using localized region-based active contours in VHR images. Remote Sensing of Environment 124: 413-426. DOI: https://doi.org/org/10.1016/j.rse.2012.05.027
ARENAS, S., HAEGER, J. F. y JORDANO, D. 2011. Aplicación de técnicas de teledetección y GIS sobre imágenes Quickbird para identificar y mapear individuos de peral silvestre (Pyrus bourgeana) en bosque esclerófilo mediterráneo. Revista de Teledetección [En línea] 35: 55-71. [Consulta 12 de mayo 2021]. Disponible en: http://www.aet.org.es/revistas/revista35/Numero35_07.pdf
AZZARI, G., JAIN, M. y LOBELL, D. B. 2017. Towards fine resolution global maps of crop yields: Testing multiple methods and satellites in three countries. Remote Sensing of Environment. 202: 129-141. DOI. https://doi.org/org/10.1016/j.rse.2017.04.014
BALLINAS, M y BARRADAS, V. L. 2015. The Urban Tree as a Tool to Mitigate the Urban Heat Island in Mexico City: A Simple Phenomenological Model. Journal of Environmental Quality. 25: 1-10. DOI: https://doi.org/10.2134/jeq2015.01.0056
BASCUÑÁN, F., WALKER, P. y MASTRANTONIO, J. 2009. Indicadores de diversidad e integración socioeconómica de ciudadanos en espacios urbanos de uso público. Urbano. [En línea] 19: 43-51. [Consulta 12 de junio 2021]. Disponible en: http://revistas.ubiobio.cl/index.php/RU/article/view/334
EVERITT, J. H., YANG, C. y JOHNSON, H. B. 2007. Canopy spectra and remote sensing of Ashe juniper and associated vegetation. Environmental Monitoring and Assessment 130: 403-413. DOI: https://doi.org/10.1007/s10661-006-9407-2
FULLER, R. A. y GASTÓN, K. J. 2009. The scaling of green space coverage in European cities. Biology Letters. 5: 352-355. DOI: https://doi.org/10.1098/rsbl.2009.0010
GIRI, C., PENGRA, B., ZHU, Z., SINGH, A. y TIESZEN, L. L. 2007. Monitoring mangrove forest dynamics of the Sundarbans in Bangladesh and India using multi-temporal satellite data from 1973 to 2000. Estuarine, Coastal and Shelf Science 73: 91-100. DOI: https://doi.org/org/10.1016/j.ecss.2006.12.019
JUMB, V., SOHANI, M. y SHRIVAS, A. 2014. Color image segmentation using K-means clustering and Otsu's adaptive thresholding. International Journal of Innovative Technology and Exploring Engineering [En línea]. 3 (9): 72-76. [Consulta 01 de enero de 2021]. Disponible en: http://www.ijitee.org/wp-content/uploads/papers/v3i9/I1495023914.pdf.
MACGREGOR-FORS, I., ORTEGA-ÁLVAREZ, R. y SCHONDUBE, J. E. 2009. On the ecological quality of urban systems: an ornithological perspective. In: Urban planning in the 21st century. D.S. Graber y K.A. Birmingham (eds.). Nova Science Publishing. 51-66. ISBN:978-1-60692-975-9
MEJÍA S, G. y GÓMEZ, R. 2015. Un análisis a la superficie de área verde por habitante en la ciudad de Tepic, Nayarit, México. Investigación Joven. 2: 1-5. ISSN 2314-3991
MENDES, D. F., DA SILVA, S. F., FERRERI, J. L., DOS SANTOS, A. R. y GARCÍA, R. F. 2015. Acurácia temática do classificador por máxima verossimilhança em imagem de alta resolução espacial do satélite Geoeye-1. Nucleus. 12: 107-118. DOI: https://doi.org/10.37378/1982.2278.1011
MEZA A, M DEL C y MONCADA M, J. O. 2010. Las áreas verdes de la ciudad de México. Un reto actual. Scripta Nova. Revista Electrónica de Geografía y Ciencias Sociales. 331 (56). ISSN: 1138-9788.
NOWAK, D. J., CRANE, D. E. y STEVENS, J. C. 2006. Air pollution removal by urban trees and shrubs in the United States. Urban Forestry & Urban Greening. 4: 115-123. DOI: https://doi.org/10.1016/j.ufug.2006.01.007
PALACIO-PRIETO J. L., SÁNCHEZ-SALAZAR, T. M., CASADO-IZQUIERDO, J. M., PROPIN-FREJOMIL, E., DELGADO-CAMPOS, J., VELÁZQUEZ-MONTES, A., CHIAS-BECERRIL, L., ORTIZ-ÁLVAREZ, M. I., GONZÁLEZ-SÁNCHEZ, J., NEGRETE-FERNÁNDEZ, G., GABRIEL-MORALES, J. y MÁRQUEZ-HUITZIL, R. 2004. Indicadores para la Caracterización y Ordenamiento del Territorio. Instituto Nacional de Ecología-SEMARNAT, Instituto de Geografía de la UNAM y Secretaría de Desarrollo Social. Convenio SEDESOL-Instituto de Geografía, UNAM. México, D.F., México. 161 p.
RASHMI C., CHALUVAIAH, S. y KUMAR, G. H. 2016. An efficient parallel block processing approach for K-means algorithm for high resolution orthoimagery satellite images. Procedia Computer Science, 89, 623-631. DOI: https://doi.org/10.1016/j.procs.2016.06.025
USGS, 2021. U.S. Geological Survey. [En línea]. [Consulta 15 de julio de 2021]. Disponible en: https://earthexplorer.usgs.gov/
Conflict of interests:
The authors declare not to have any interest conflicts.
Authors' contribution:
The authors have participated in the writing of the work and analysis of the documents.
![]()
This work is licensed under a Creative Commons Attribution-NonCommercial 4.0
International license.
Copyright (c) 2022
Javier Jiménez Pérez, Rufino Sandoval García, Eduardo Alanís Rodríguez, José Israel Yerena Yamallel, Oscar Alberto Aguirre Calderón