Cuban Journal of Forest Sciences. 2022; May-August 10(2): 150-168![]()
Translated from the original in spanish
Original article
Impact of climate change in forest fire initiation in Las Tunas
Impacto del cambio climático en la generación de incendios forestales en Las Tunas
Impacto da mudança climática sobre a geração de incêndios florestais em Las Tunas
María de los Ángeles Zamora
Fernández1*![]() https://orcid.org/0000-0002-2302-7076
https://orcid.org/0000-0002-2302-7076
Julia Azanza Ricardo2![]() https://orcid.org/0000-0002-9454-9226
https://orcid.org/0000-0002-9454-9226
Arnoldo Bezanilla Morlot3![]() https://orcid.org/0000-0001-8586-9116
https://orcid.org/0000-0001-8586-9116
1Inversiones GAMMA S.A. Company. Cuba.![]()
2Higher Institute of Technology and Applied Sciences. Cuba.![]()
3Institute of Meteorology. Cuba.![]()
*Corresponding author: julia_dragmarino@yahoo.es
Received:09/25/2021.
Approved:04/25/2022.
ABSTRACT
In recent decades, the area affected and the severity of forest fires have increased in many regions of the world. Without anticipatory adjustments, climate change is likely to increase their frequency and intensity. This study aims to assess the possible impact of climate change on the initiation of forest fires in Las Tunas, The purpose of this study was to assess the possible impact of the climate change in forest fires initiation in Las Tunas, which is a most deforested region in Cuba thus a vulnerable region to aridity, drought and prone to forest fires. Taking into account the characteristics of the meteorological variables, the aridity conditions and the behavior of forest fires, a long-term risk index was used. It allows determining by months the areas with favorable conditions for the start and development of fires. Based on the possible changes in the meteorological variables in the RCP2.6 and RCP8.5 scenarios, this index was evaluated, which allowed obtaining the areas with the highest fire risk for the periods 2020-2049, 2050-2079 and 2080-2099. In general, in the territory of Las Tunas, there is a tendency to warmer conditions with reductions in rainfall, especially in the north coast. Besides, there is a decrease in relative humidity, which will lead to more areas affected by aridity and drought. Also, there will be larger areas with the presence of fire danger conditions for vegetation.
Keywords: Aridity; Forest fires; Regional climate models.
RESUMEN
En las últimas décadas, ha aumentado la superficie afectada y la severidad de los incendios forestales en muchas regiones del mundo. Sin ajustes previsores, es muy probable que el cambio climático incremente la frecuencia y la intensidad de estos. Este estudio tiene como objetivo evaluar el posible impacto del cambio climático en la generación de incendios forestales en Las Tunas, al ser esta la región más deforestada de Cuba, vulnerable a la aridez, la sequía y propensa a incendios forestales. Teniendo en cuenta las características de las variables meteorológicas, las condiciones de aridez y el comportamiento de los incendios forestales, se uso un índice de riesgo de largo plazo que permite determinar por meses las zonas con condiciones favorables para el inicio y desarrollo de incendios. Basándose en los posibles cambios de las variables meteorológicas en los escenarios RCP2.6 y RCP8.5, se evaluó dicho índice, lo que permitió obtener las zonas con mayor riesgo de incendio para los períodos 2020-2049, 2050-2079 y 2080-2099. De manera general, en el territorio de Las Tunas, se avanza hacia condiciones más cálidas con reducciones en las precipitaciones, especialmente hacia la costa norte, y una disminución de la humedad relativa, lo que conllevará a más zonas afectadas por la aridez y la sequía, y mayores áreas con presencia de condiciones de peligro de incendios para la vegetación.
Palabras claves: Aridez; Incendios forestales; Modelos climáticos regionales.
RSUMO
Nas últimas décadas, a área afetada e a gravidade dos incêndios florestais têm aumentado em muitas regiões do mundo. Sem ajustes pró-ativos, é muito provável que a mudança climática aumente a freqüência e a intensidade dos incêndios florestais. Este estudo visa avaliar o possível impacto da mudança climática na geração de incêndios florestais em Las Tunas, que é a região mais desmatada de Cuba, vulnerável à aridez, à seca e propensa a incêndios florestais. Levando em conta as características das variáveis meteorológicas, as condições de aridez e o comportamento dos incêndios florestais, foi utilizado um índice de risco de longo prazo para determinar, mês a mês, as áreas com condições favoráveis para o início e desenvolvimento dos incêndios. Com base nas possíveis mudanças nas variáveis meteorológicas nos cenários RCP2.6 e RCP8.5, este índice foi avaliado, o que permitiu obter as áreas com maior risco de incêndio para os períodos de 2020-2049, 2050-2079 e 2080-2099. Em geral, no território de Las Tunas, há um movimento em direção a condições mais quentes com reduções de precipitação, especialmente em direção à costa norte, e uma diminuição da umidade relativa, o que levará a mais áreas afetadas pela aridez e seca, e maiores áreas com condições de risco de incêndio para a vegetação.
Palavras-chave: Aridez; Icêndios florestais; Modelos climáticos regionais.
INTRODUCTION
Climate change constitutes additional pressure on ecosystems and the goods and services they provide, mainly in Central America and the Caribbean (Conde and López (2017). In recent decades, the area affected and the severity of forest fires have increased in many regions of the world (De Groot et al., 2012), climate change is expected to increase their frequency and intensity, due to the alteration of the spatial and temporal distribution of temperature, rainfall, solar radiation and the winds (De Groot et al., 2012).
Researches on the occurrence of fires has increased gradually over the years, with special attention to the development of danger indexes (Solano 2004, Carrasco 2016). Danger indexesare classified into short-term and long-term. The short-term indexes, estimates a daily fire risk and are made for tactical and operational purposes; with the latter, risks are evaluated at various scales for strategic purposes. Long-term fire danger indexes are indicators of stable conditions that favor the occurrence of a fire. These indexes are used to determine areas with a high risk of fire caused by the intrinsic conditions of the area, as well as to determine areas where fire prevention and combat should be reinforced (Torres et al., 2007).
There is still much uncertainty regarding the future evolution of climate change, its real repercussions and possible responses (Camia et al., 2016). Thanks to the use of regional climate models, projections of the behavior of the different meteorological variables have been developed for different climate change scenarios with significantly higher resolutions and without requiring large computational resources (IPCC 2013). This has made it possible to carry out research in different regions of the world and more precise impact studies at a regional and local scale (Almazroui 2013, Vichot-Llanos et al., 2019).
In Cuba, forest fires constitute a phenomenon that increases deforestation, soil degradation and loss of biological diversity (Díaz et al., 2013). Forest fire statistics indicate a reinforcement of the trend of fire increasementin recent years, as well as the area affected by them (Solano, 2004).
The province of Las Tunas has been considered one of the most vulnerable to aridity processes and forest fires (Vázquez et al., 2016, Planos et al., 2013), due to the characteristics of the soils and the climatic situation of the region (low annual rainfall, high temperatures and frequent and intense drought processes). Planos et al., (2013) identified that all types of existing soil are highly susceptible to degradation processes. Besides, Las Tunas has being identified as the most deforested provinces in Cuba, with small forested areas, and mostly deteriorated.
In Cuba, the impact of climate change on plant formations has already been evaluated (Álvarez et al., 2011; Planos et al., 2013; Pérez et al., 2017). However, little research has been done using the possible climate scenarios obtained with a regional climate model to predict the impact on plant formations, and even less on drylands. Most of the studies cited have been carried out from a national perspective, without including local particularities, especially areas of the country that are highly affected by drought, such as Las Tunas. For this reason, the objective of this study is to assess the impact of climate change on the initiation of forest fires in Las Tunas.
MATERIALS AND METHODS
General characteristics of the territory
Las Tunas province (Figure 1) is located in the eastern region of Cuba between 20º 30' and 21º 27' north latitude and 77º 48' and 76º 58' west longitude. It is bordered to the north by the Atlantic Ocean, to the south by Granma province and the Gulf of Guacanayabo, to the east by Holguín province, and to the west by Camagüey province (ONEI 2021). It has eight municipalities: Manatí, Puerto Padre and Jesús Menéndez, located on the north coast; Majibacoa and Las Tunas, located in the central region; Jobabo, Colombia and Amancio, located on the south coast. The provincial capital is the municipality of Las Tunas. The province has a surface area of 6,592.66 km2 (ONEI 2021).
The relief is eminently flat (ONEI 2021) with semi-desert soils, dry savannah-type forests and areas used for agriculture (Galford et al., 2018). There are anthropic and natural soils, but brown soils predominate, and according to the agroproductive classification of these, most are very unproductive (ONEI 2021).
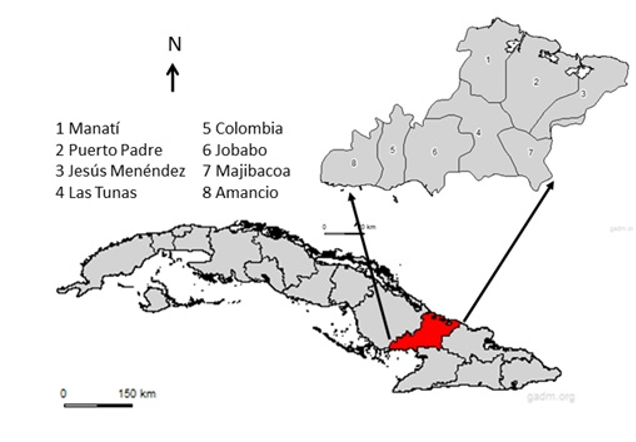
Figure. 1. - Study area
In most of the territory the average annual temperatures are above 26 ºC; the minimum annual temperature is higher towards the central and northern parts, with values between 22 ºC and 24 ºC. The average of maximum temperatures are between 29 and 31 ºC. The highest dew point temperature values are found towards the north coast, between 21 and 21.5 ºC. Relative humidity is between 75 and 80 %. The speed of the wind in the territory exceeds 2 m/s-1, reaching average values above 3.5 m/s-1 on the north coast. The average accumulated rainfall in almost the entire province, exceeds 1,150 mm, except for the north coast, where they are less than 950 mm. The annual reference evapotranspiration ranges between 1,500 mm and 1,700 mm.
Data collection
The data on forest fires were obtained at the CITMA office in the province of Las Tunas, which in turn were provided by the Forest Ranger Corps (CGB) in the period from 2008 to 2012. The series of meteorological data were extracted from the database of the Climate Center belonging to the Institute of Meteorology of the Republic of Cuba (INSMET). The meteorological stations closest to the study region (Figure 2) were used in the period from 1989 to 2018. The variables considered were: Hr -relative humidity (%), T-air temperature (ºC), Tmax -Maximum temperature, Td -dew point temperature (ºC ), FF-wind speed (m s-1) and R-precipitation (mm). In addition, the reference evapotranspiration value (Et0) was obtained from the FAO Penman-Monteith equation, following the recommendations of Solano (2004) for Cuban conditions.

Figure. 2. - Location of weather stations
The data of the climate change scenarios were obtained from the Department of Physics of the Atmosphere of the Institute of Meteorology in netCDF format. Data from the PRECIS system (Providing Regional climates for hits Studies) which consists of the Hadley Centre's regional climate model, HadRM3P, supplied with the boundary conditions produced by the updated atmospheric component outputs of the Hadley Center HadAMP3 global coupled model at 25 km resolution. The variables analyzed were: Hr -relative humidity at 1.5 m (%), T-air temperature 1.5 m (ºC ), Tmax -Maximum temperature 1.5 m (ºC ), Td -dew point temperature 1.5 m (ºC ), u-zonal component d of the wind at 10 m (m s-1), v-meridional component of the wind at 10 m (m s-1), R-precipitation (mm) and reference evapotranspiration (Et0) (mm) according to their monthly mean values.
Data processing
The annual and monthly mean values of the variables relative humidity, air temperature, maximum temperature, dew point temperature, wind speed, precipitation and reference evapotranspiration were calculated in the period 1989-2018 in each of the stations.
The RCP2.6 and RCP8.5 scenarios were chosen to analyze the trends of the meteorological variables in the coming years, which model the extreme climatic conditions (minimum and maximum scenarios, respectively). The 2020-2099 period was divided into three stages: a near period (2020-2049), an intermediate period (2050-2079), and a distant period (2080-2099). In each of the periods, for each of the scenarios, the annual and monthly average values of the meteorological variables and the changes with respect to the reference period of the model (1961-1990) were calculated.
To analyze the aridity conditions, the Aridity Index (Middleton and Thomas 1992), the Water Deficit Index (DH), the Modified Fournier Index (MFI), the Precipitation Concentration Index (ICP) and the Index of Lang were selected, and the values of these indexes were obtained for the RCP 2.6 and RCP 8.5 scenarios in the near period (2020-2049), intermediate period (2050-2079) and distant period (2080-2099).
Forest fires in the period 2008-2012 were studied taking into account their distribution in years, months, affected forest formation, total affected area, seasonal period (rainy period and dry period) and causes (Ramos and Soares 2005; Rodríguez et al., 2013; Carrasco, 2016). It was determined if there were significant differences between the affected area and the meteorological variables by months through the non-parametric Kruskal-Wallis test. Spearman's correlation coefficient was then calculated between the area affected by forest fires and the meteorological variables. Statsoft software was used Statistica version 8.0 for statistical tests. Non-parametric tests were used due to their flexibility regarding the nature of the data analyzed and because they are less restrictive in terms of the premises for their analysis.
A long-term risk index (Zamora 2020) was applied to determine the distribution of areas with favorable conditions according to meteorological variables and aridity conditions for the occurrence and dispersion of forest fires in each of the months. This index was evaluated for the three periods of the two climate change scenarios analyzed. This will allow determining the areas with the greatest risk of the impacts of climate change and how this can affect the fire season.
To create the maps, the recommendations of Tveito were followed (2007) and Maglione et al. (2019) andthe Python 3.6.3 cartopy module was used.
RESULTS AND DISCUSSION
Characteristics of forest fires
In the period 2008-2012, a total of 504 fires occurred in the province of Las Tunas (Figure 3A), with a total affected area of 17,344.3 ha, which represents 2.63 % of the total land area of the province. The most affected forest formation was sugarcane, with about 60 % of the fires, especially in the municipalities of the north coast (Figure 3B). Sugarcane is a large biomass producer crop that is also closely related to agricultural burning activities (Cabrera and Zuaznábar 2010). This differs from the province of Pinar del Río, where the most affected forest formation is that of Pinus spp. (Rodriguez et al., 2013; Carrasco 2016). The municipality with the highest number of fires and affected area was Puerto Padre, which has the lowest accumulated historical average rainfall, the highest values of reference evapotranspiration and wind speed (Zamora and Azanza 2020). This municipality has also been pointed out by Planos et al. (2013) as one of the 15 municipalities with the highest risk of forest regressive death in the country.
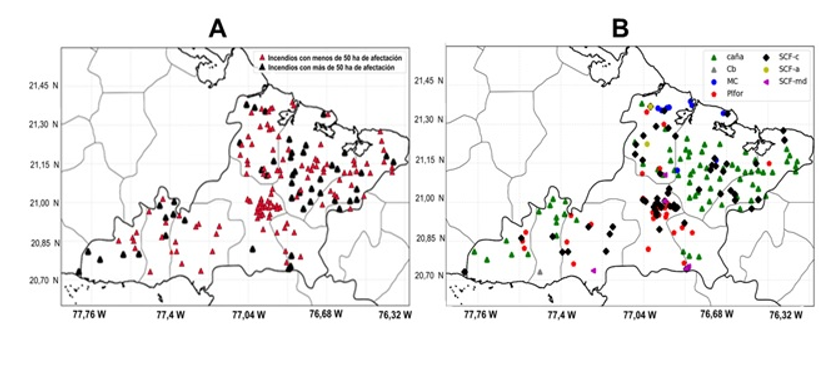
Figure. 3. - Location of ignition points on the province of Las Tunas
A: according to the size of the fire
and B: according to the type of forest formation. Cb: Cuabal, MC: Coastal Manigua, Plfor:
Heterogeneous forest formations, Ç
SCF-c: Semi -deciduous on limestone soil, SCF-a: Semi-deciduous on acid soil, SCF-
md: Semi -deciduous on poorly drained soil.
The months with the highest number of fires and the largest affected area (Table 1) were the months of the year with little rain (Zamora and Azanza 2020), especially from February to April. In these months, the combustible material tends to increase its flammability and availability due to the low water content of the fibers (Carrasco 2016). The results indicated that, in addition, in this period the lowest historical averages of the variables dew point temperature, relative humidity and accumulated precipitation were reported. At the same time, the highest historical averages of wind speed were registered in the meteorological stations studied (Zamora and Azanza 2020).
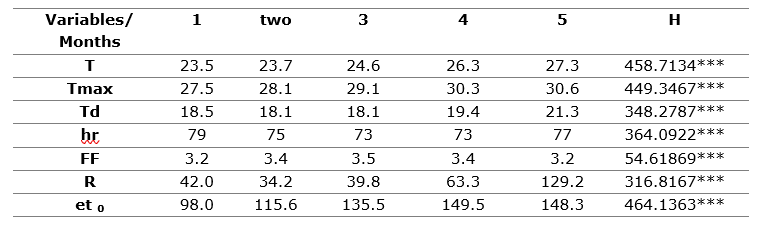
The comparison between the historical mean values of the variables for the first five months of the year (Table 2) showed that there were significant differences for all the variables. This result determined the need to make a differentiation between the meteorological conditions propitious to forest fires in correspondence with the month.
Table 1. - Number of fires, affected area and area per fires per month
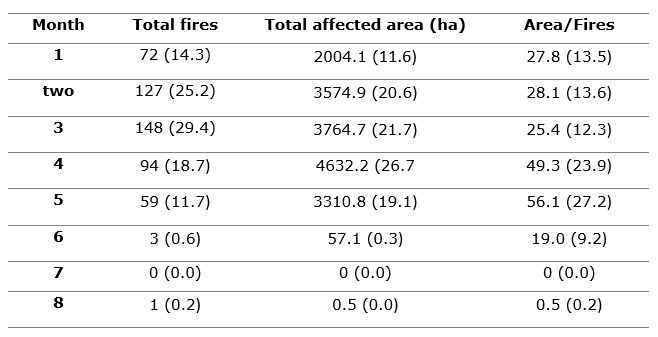
Note: In parentheses the values of relative frequency (RF) in %
Table 2. - Comparison of the mean values of eight meteorological variables between the months
of January, February, March, April and May.
The Kruskal-Wallis test was used
with a significance value of 0.05
When analyzing the correlation values (Table 3), significant values were found for the variables mean temperature, maximum, dew point, relative humidity and wind speed. However, the values of these correlations are low and, in some cases, such as relative humidity, have values contrary to what was found by Carrasco (2016). The correlations between the affected area and the meteorological variables in general were not very informative because the degree of affectation does not depend only on the meteorological variables, which was also found by Carrasco (2016). The origin of the fires was also decisive since most of them were caused by man intentionally or accidentally.
Table 3. - Spearman correlation between affected area and meteorological variables
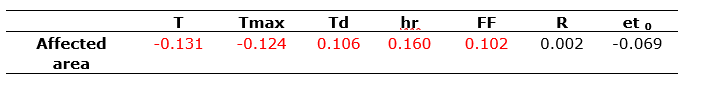
Significant values are marked in red. Hr: relative humidity (%), T: air temperature (ºC), Td: dew point temperature (ºC ), FF: wind speed (m s-1), R: accumulated rainfall (mm) and Et0 : reference evapotranspiration (mm).
Climate change scenarios
For the RCP2.6 scenario (Figure 4) the changes in the meteorological variables remain almost constant in the three periods, while the greatest differences occur in the RCP8.5 scenario (Figure 5), especially in the period 2080- 2099. For the average temperature, the maximum temperature and the dew point temperature, in the RCP2.6 scenario an increase of more than 1 ºC is observed in the average values for the three periods and for the RCP8.5, changes greater than 4 ºC in the last period, mainly in the interior-south of the province. In the case of relative humidity, it shows a downward trend in almost the entire territory, with the maximum change (6 %) found in the RCP8.5 scenario in the third period. On the other hand, the variations in wind speed do not exceed 0.5 m s-1 in any of the scenarios, neither positive nor negative. Precipitation presents a great spatial variability, since there are areas with increases and others with decrease. In the RCP2.6 scenario, increases of almost 10 % are observed in some areas, while for the RCP8.5 scenario, from 2050, the trend is to decrease, especially on the north coast. The greatest decrease occurs towards the north coast, in the distant period, with values greater than 20 %. Another interesting element to point out is the decrease in rainfall in the months of the year's rainy season and the increase in the dry season. These results were also found in works such as the one by Planos et al. (2013) and Pérez et al. (2017). On the other hand, with respect to the reference evapotranspiration, the tendency is to increase, being the period of 2080-2099 the one with the greatest increase, which exceeds 10 %.
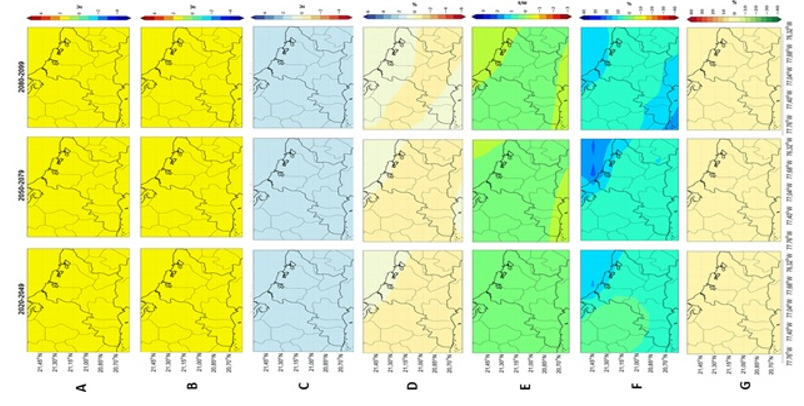
Figure. 4. - Projection of the variations of the meteorological variables for the RCP2.6 scenario in the periods
2020-2049, 2050-2079 and 2080-2099
A: Average temperature (ºC), B: Maximum
temperature (ºC), C: Dew point temperature (ºC), D: Relative humidity (%), E: Wind speed (m
s-1), F: Accumulated rainfall (mm), G: Reference evapotranspiration (mm).

Figure. 5. - Projection of the variations of the meteorological variables for the RCP8.5 scenario in the periods
2020-2049, 2050-2079 and 2080-2099
A: Average temperature (ºC), B: Maximum
temperature (ºC), C: Dew point temperature (ºC), D: Relative humidity (%), E: Wind speed (m
s-1), F: Accumulated rainfall (mm), G: Reference evapotranspiration (mm).
Based on changes in meteorological variables, aridity conditions in the province of Las Tunas can be projected (Figure 6). The projections of the Lang Index and the Aridity Index show an increase in dry and very dry conditions, and in dry and semi-arid sub-humid zones, respectively, for the RCP8.5 scenario in the distant period. The Water Deficit also increases in the territory, especially towards the north coast, with the largest increase in the period 2080-2099 for the RCP8.5 scenario. However, according to the results of the IFM, the intensity of precipitation decreases, mainly due to the decrease in precipitation in the last period, in addition to the increase in areas with seasonal characteristics of precipitation. These results suggest an increase of arid conditions in the province of Las Tunas, especially towards the north coast.
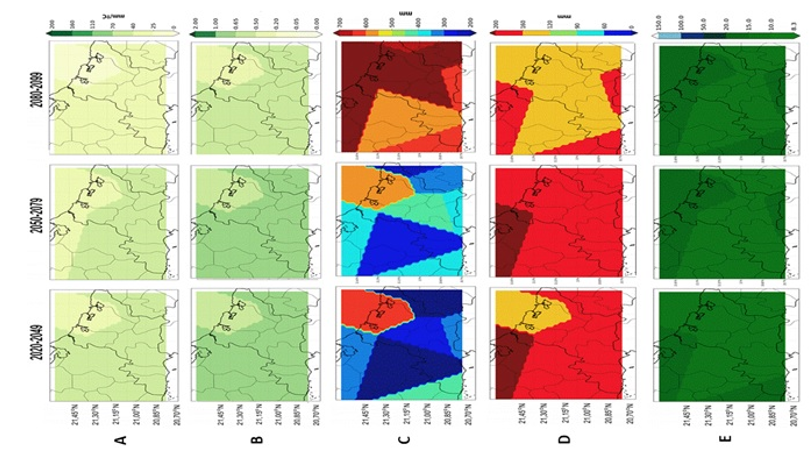
Figure. 6. - Projections of the aridity indices for the RCP8.5 scenario in the periods
2020-2049, 2050-2079 and 2080-2099.
A: Lang Index (mm
ºC-1), B: Aridity Index, C: Water Deficit (mm), D:
Modified Fournier Index (mm), E: Precipitation Concentration Index
In general, the territory of Las Tunas is moving towards warmer conditions with reductions in rainfall, especially towards the north coast, and a decrease in the relative humidity of the air. These results are in correspondence with the investigations of Planos et al. (2013) where he stated that the impact of climate change on the Cuban archipelago will be evidenced by the existence of a hot and extreme climate and with more areas affected by desertification and drought, among others. These impacts will generate important consequences in the sustainable development and quality of Cubans' life, fundamentally in sectors such as agri-food, tourism and human settlements (Pérez et al., 2017).
The decrease in precipitation in contrast to the increase in baseline evapotranspiration, will result in larger areas affected by drought, larger areas with the presence of fire danger conditions for vegetation, and the appearance of semi-arid and arid areas. All this will result in prolonged and intense periods of water stress in crops during almost the entire year (Pérez et al., 2017).
Impact of climate change on forest fires
Taking into account the projections of the climate change scenarios, the index proposed by Zamora (2020) was evaluated. The results showed that in the RCP2.6 scenario (Figure 7), the conditions remain almost constant in the three periods with a slight tendency to decrease in the areas with high and moderate risk, which corresponds to the characteristics of the scenario itself. In general, in the last period with respect to the reference period, a decrease of 10 % in moderate conditions is observed throughout the year and, consequently, an increase in areas with low risk. The months of greatest risk continue to be March and April, although high-risk areas appear in July and August on the north coast, especially in the 2020-2049 period. Therefore, favorable conditions for forest fires can be expected in other months of the year, when they were not so likely before.
For the RCP8.5 scenario (Figure 8), wildfire risk conditions increase in all periods. Generally, throughout the year, for the last period an increase of more than 40 % of high-risk conditions is observed. The months of greatest risk continue to be March and April; however, this situation changes as the years go by, being, in the last period, July and August the months that present the highest proportion of areas with extreme risk of forest fires. This situation can be explained due to the decrease in rainfall in the months of the rainy season and its increase in the dry season. For the 2080-2099 period, conditions with moderate risk are also present in all the months of the year and conditions with high risk in almost all the months, except in October.
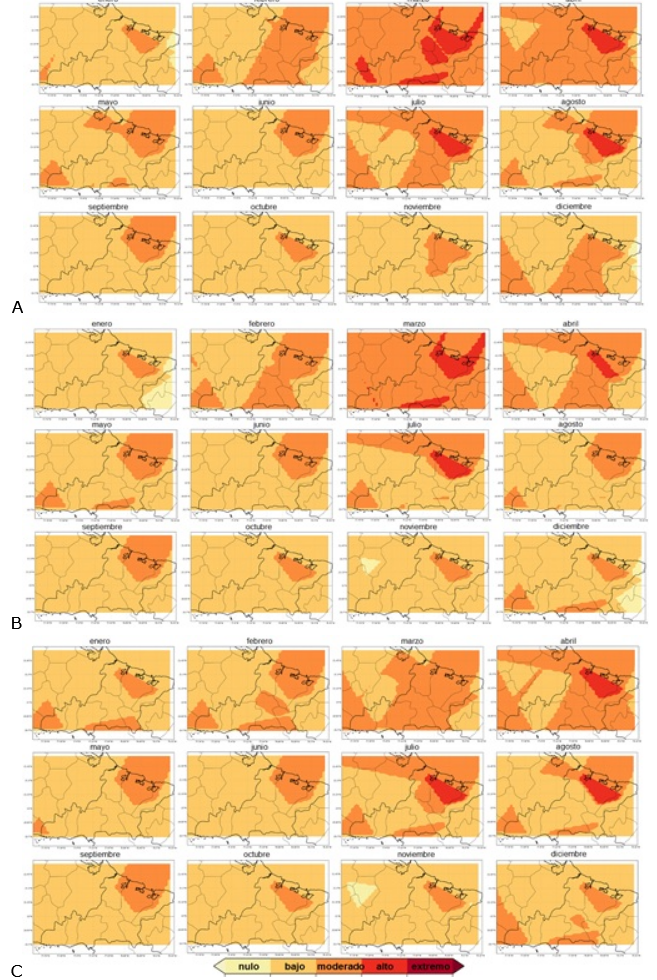
Figure. 7. - Risk of forest fires in the province of Las Tunas for each month of the year according to
the RCP2.6 scenario in three periods:
A: 2020-2049, B: 2050-2079 and C: 2080-2099
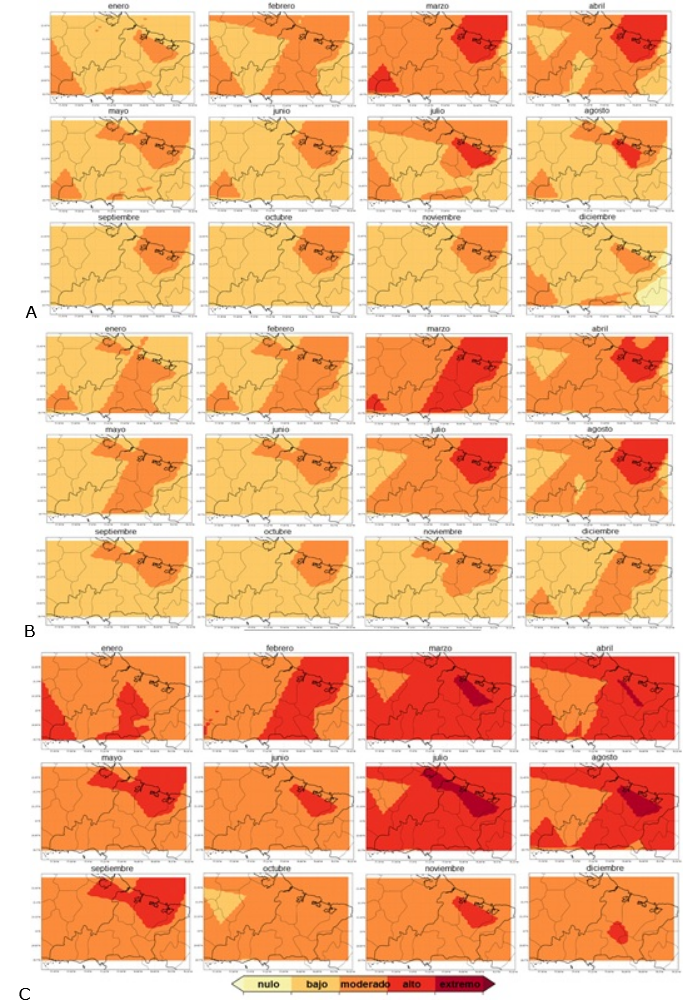
Figure. 8. - Risk of forest fires in the province of Las Tunas for each month of the year according to
the RCP 8.5 scenario in three periods:
A: 2020-2049, B: 2050-2079 and C: 2080-2099
This increase in favorable forest wildfire conditions corresponds with the investigations of De Groot et al. (2012), Doerr and Santín (2016) and Camia et al. (2016) done in different parts of the world. These results suggest that there will be longer fire seasons in the province that will lead to an increase in the number of fires or an increase in their intensity, which will cause a greater affected area.
Climate change will affect fire regimes, resulting in large ecological impacts. Therefore, fire management strategies must be adapted to this changing climate and to the situation of each locality (Camia et al. 2016). In Las Tunas it is necessary to pay special attention to the north coast, especially the municipality of Puerto Padre, which presents the most dangerous situation. Over time, it will become even more necessary to take severe measures with respect to intentional fires, especially in sugar cane crops.
CONCLUSIONS
It was possible to projectthe possible impact of climate change on the generation of forest fires in Las Tunas, through the development of a long-term index based on meteorological variables, aridity, the possible changes caused by climate change and the characteristics of the forest fires.
The results suggest, with differences between scenarios, that there will be longer fire seasons in the province that will lead to an increase in the number of fires or an increase in their intensity, which will cause a greater affected area.
In general, the territory of Las Tunas is moving towards warmer conditions with reductions in rainfall, especially towards the north coast, and a decrease in the relative humidity of the air, which will lead to more affected areas by aridity and drought, and larger areas with the presence of fire danger conditions for vegetation.
ACKNOWLEDGEMENT
We thank the specialists of the CITMA of the province of Las Tunas for their help in carrying out this study, especially Reynol Pérez Fernández. We also want to thank the specialists of the Climate Center belonging to the Institute of Meteorology of the Republic of Cuba for providing us with the necessary data to evaluate the meteorological variables.
REFERENCES
ALMAZROUI, M., 2013. Simulation of present and future climate of Saudi Arabia using a regional climate model (PRECIS). International Journal of Climatology [en línea], vol. 33, no. 9. DOI 10.1002/joc.3721. Disponible en: https://www.researchgate.net/publication/264252765_Simulation_of_present_and_future_climate_of_Saudi_Arabia_using_a_regional_climate_model_PRECIS.
ÁLVAREZ BRITO, A., MERCADET PORTILLO, A., ORTIZ, O., CORDERO, E., HECHAVARRÍA, O. y SUÁREZ, T., 2011. El sector forestal cubano y el cambio climático [en línea]. La Habana: Instituto de Investigaciones Agro - Forestales. [Consulta: 6 octubre 2021]. Disponible en: https://docplayer.es/64215367-El-sector-forestal-cubano-y-el-cambio-climatico.html.
CABRERA, J.A., Zuaznábar, R., 2010. Impacto sobre el ambiente del monocultivo de la caña de azúcar con el uso de la quema para la cosecha y la fertilización nitrogenada. I. Balance del carbono. Cultivos Tropicales [en línea], vol. 31, no. 1, pp. 5-13. ISSN 0258-5936. Disponible en: http:// scielo.sld.cu/scielo.php?script=sci_isoreft&pid=S0258-593620100001&lng=es&tlng=es.
CAMIA, A., LIBERTÀ, G. y SAN-MIGUEL-AYANZ, J., 2016. Modeling the impacts of climate change on forest fire danger in Europe: Sectorial results of the PESETA II Project [en línea]. Luxemburgo: Publications Office of the European Union. [Consulta: 6 octubre 2021]. ISBN 978-92-79-66259-1. Disponible en: https://data.europa.eu/doi/10.2760/768481.KJ-04-17-227-EN-N
CARRASCO RODRÍGUEZ, Y., 2016. Índice meteorológico de peligro de incendio forestal para la provincia Pinar del Río, Cuba [en línea]. La Habana: Editorial Universitaria. [Consulta: 8 septiembre 2020]. ISBN 978-959-16-3401-6. Disponible en: http://eduniv.reduniv.edu.cu/index.php?page=13&id=157&db=1.
DÍAZ DUQUE, J.A., MENÉNDEZ CARRERA, L., GUZMÁN MENÉNDEZ, J.M. y GARCÍA, E.E., 2013. Principales problemas ambientales y ecológicos que influyen en la sostenibilidad de la República de Cuba. IX Convención Internacional de Medio Ambiente y Desarrollo [en línea]. La Habana: s.n., [Consulta: 6 octubre 2021]. Disponible en: https://www.researchgate.net/publication/304515545_PRINCIPALES_PROBLEMAS_AMBIENTALES_Y_ECOLOGICOS_QUE_INFLUYEN_EN_LA_SOSTENIBILIDAD_DE_LA_REPUBLICA_DE_CUBA.
DOERR, S.H. y SANTÍN, C., 2016. Global trends in wildfire and its impacts: perceptions versus realities in a changing world. Philosophical Transactions of the Royal Society B: Biological Sciences [en línea], vol. 371, no. 16-96, pp. 2015-0345. [Consulta: 8 septiembre 2020]. DOI 10.1098/rstb.2015.0345. Disponible en: https://royalsocietypublishing.org/doi/10.1098/rstb.2015.0345.
GALFORD, G., FERNÁNDEZ, M., ROMAN, J., MONASTEROLO, I., AHAMED, S., FISKE, G., GONZÁLEZ DÍAZ, P. y KAUFMAN, L., 2018. Cuban land use and conservation, from rainforests to coral reefs. Bulletin of Marine Science [en línea], vol. 94, no. 2. DOI 10.5343/bms.2017.1026. Disponible en: https://www.researchgate.net/publication/322793466_Cuban_land_use_and_conservation_from_rainforests_to_coral_reefs.
GROOT, W.J. de, FLANNIGAN, M.D. y STOCKS, B.J., 2012. El cambio climático y los incendios forestales. Memorias [en línea]. México: s.n., Disponible en: https://www.fs.fed.us/psw/publications/documents/psw_gtr245/es/psw_gtr245_001.pdf.
MAGLIONE, D., SOTO, J., SÁENZ, J.L. y BONFILI, O., 2019. Utilización de diferentes metodologías para la construcción de un mapa de precipitación acumulada en la Provincia de Santa Cruz. Informe Científico Técnico UNPA [en línea], vol. 11, no. 1, pp. 154-169. [Consulta: 9 octubre 2021]. ISSN 1852-4516. Disponible en: https://dialnet.unirioja.es/servlet/articulo?codigo=7342657.
MIDDLETON, N. y THOMAS, D., 1992. World atlas of desertification. [en línea]. Londres: United Nations Environment Programme (UNEP). [Consulta: 11 octubre 2021]. ISBN 978-0-340-55512-5. Disponible en: https://digitallibrary.un.org/record/246740.
OFICINA NACIONAL DE ESTADÍSTICA E INFORMACIÓN, 2021. Anuario Estadístico de Cuba. Año 2020. Enero-Diciembre 2020. Edición 2021 [en línea]. Disponible en: http://www.onei.gob.cu/node/16275.
PANEL INTERGUBERNAMENTAL SOBRE CAMBIO CLIMÁTICO, 2013. Resumen para responsables de políticas. Cambio Climático 2013: Bases físicas [en línea]. Reino Unido: Cambridge University Press, Disponible en: https://archive.ipcc.ch/pdf/assessment-report/ar5/wg1 /WG1_AR5_SPM_ES.pdf.
PÉREZ MONTERO, O., ÁLVAREZ ADÁN, A. y GÓMEZ VILLA, Y., 2017. Cambio climático y vulnerabilidades en Cuba. Variabilidad y cambio climático. Impactos, vulnerabilidad y adaptación al cambio climático en América Latina y el Caribe [en línea]. México: Instituto Nacional de Ecología y Cambio Climático, [Consulta: 6 octubre 2021]. Disponible en: http://www.gob.mx/inecc/documentos/variabilidad-y-cambio-climatico-impactos-vulnerabilidad-y-adaptacion-al-cambio -climatico-en-america-latina-y-el-caribe.
PLANOS GUTIÉRREZ, E., RIVERO VEGA, R. y GUEVARA VELAZCO, V., 2013. Impacto del cambio climático y medidas de adaptación en Cuba [en línea]. La Habana: CITMA. [Consulta: 8 septiembre 2020]. ISBN 978-959-300-039-0. Disponible en: http://webcache.googleusercontent.com/search?q=cache:s7-4Sbb-w6QJ:repositorio.geotech.cu/jspui/bitstream/1234/2820/1 /Impacto%2520del%2520Cambio%2520Clim%25C3%25A1tico%2520y%2520Medidas%2520de%2520Adaptaci%25C3%25B3n%2520en%2520Cuba%2520Introducci%25C3%25B3n.pdf+&cd=3&hl=es&ct=clnk&gl=cu
RAMOS RODRÍGUEZ, M. y SOARES, R., 2005. Análisis comparativo entre los incendios forestales en Monte Alegre, Brasil y Pinar del Río, Cuba. Floresta [en línea], vol. 34, no. 2. DOI 10.5380/rf.v34i2.2379. Disponible en: https://www.researchgate.net/publication/269735824_ANALISIS_COMPARATIVO_ENTRE_LOS_INCENDIOS_FORESTALES_EN_MONTE_ALEGRE_BRASIL_Y_PINAR_DEL_RIO_CUBA.
RODRÍGUEZ, R.G., RAMOS RODRÍGUEZ, M., DANGEL, A.D., SOARES, R.V., BATISTA, A. y TETTO, A., 2013. Incendios forestales y grado básico de peligro en la empresa forestal Macurije, Cuba. Revista Brasileira de Ciências Agrárias [en línea], vol. 8, no. 2, pp. 279-286. DOI 10.5039/agraria.v8i2a2531. Disponible en: https://www.researchgate.net/publication/269948117_Incendios_forestales_y_grado_basico_de_peligro_en_la_empresa_forestal_Macurije_Cuba.
SOLANO OJEDA, O., VÁZQUEZ, R., MENÉNDEZ, J.A., PÉREZ, E. y FIGUEREDO LEÓN, M., 2004. Sistema de vigilancia y alerta de condiciones agrometeorológicas de peligro potencial de incendios de vegetación. Revista Cubana de Meteorología [en línea], vol. 11, no. 2. [Consulta: 11 octubre 2021]. ISSN 2664-0880. Disponible en: http://rcm.insmet.cu/index.php/rcm/article/view/325.
TORRES ROJO, J.M., MAGAÑA TORRES, O.S. y RAMÍREZ FUENTES, G.A., 2007. Índice de peligro de incendios forestales de largo plazo. Agrociencia [en línea], vol. 41, no. 6, pp. 663-674. [Consulta: 9 septiembre 2020]. ISSN 1405-3195. Disponible en: http://www.scielo.org.mx/scielo.php?script=sci_abstract&pid=S1405-31952007000600663&lng=es&nrm=iso&tlng=es.
TVEITO, O.E., 2007. The Developments in Spatialization of Meteorological and Climatological Elements. Spatial Interpolation for Climate Data [en línea]. Estados Unidos: John Wiley & Sons Ltd., pp. 73-86. [Consulta: 11 octubre 2021]. ISBN 978-0-470-61226-2. Disponible en: https://onlinelibrary.wiley.com/doi/abs/10.1002/9780470612262.ch6.
VÁZQUEZ, R., FERNÁNDEZ, A., SOLANO, O., LAPINEL, B. y RODRÍGUEZ, F., 2016. Mapa de Aridez de Cuba. Zonas Áridas [en línea], vol. 11, no. 1, pp. 101-109. [Consulta: 11 octubre 2021]. ISSN 1814-8921. DOI 10.21704/za.v11i1.207. Disponible en: https://revistas.lamolina.edu.pe/index.php/rza/article/view/207.
VICHOT LLANO, A., BEZANILLA MORLOT, A., MARTÍNEZ CASTRO, D. y CENTELLA ARTOLA, A., 2019. Estado actual de la aplicación de métodos de reducción de escala a las proyecciones de cambio climático en Centroamérica y el Caribe. Revista Cubana de Meteorología [en línea], vol. 25, no. 2. [Consulta: 11 octubre 2021]. ISSN 2664-0880. Disponible en: http://rcm.insmet.cu/index.php/rcm/article/view/467.
ZAMORA FERNÁNDEZ, M.A., AZANZA RICARDO, J., 2020. Influencia de factores meteorológicos en la generación de incendios en la provincia de las Tunas. Revista Cubana de Ciencias Forestales, vol. 8 no. 3, pp. 519-534. ISSN: 19962452 RNPS: 2148. Disponible en: http://cfores.upr.edu.cu/index.php/cfores/article /view/639.
Conflict of interests:
The authors declare not to have any interest conflicts.
Authors' contribution:
María de los Ángeles Zamora
Fernández: Conception of the idea, literature search and review, instrument making, instrument application, compilation of information resulting from the instruments applied,
statistic análisis, preparation of tables, graphs, and images, database preparation, general advice on the topic addressed, drafting of the original (first version),
review and final version of the article, article correction, authorship coordinator, translation of terms or information obtained, review of the application of the applied bibliographic standard.
Julia Azanza Ricardo: Conception of the idea, literature search and review, instrument making, instrument application, compilation of information resulting from the instruments applied, statistic análisis, preparation of tables, graphs, and images, database preparation, general advice on the topic addressed, drafting of the original (first version), review and final version of the article, article correction, authorship coordinator, translation of terms or information obtained, review of the application of the applied bibliographic standard.
Arnoldo Bezanilla Morlot: Conception of the idea, literature search and review, instrument making, instrument application, compilation of information resulting from the instruments applied, statistic análisis, preparation of tables, graphs, and images, database preparation, general advice on the topic addressed, drafting of the original (first version), review and final version of the article, article correction, authorship coordinator, translation of terms or information obtained, review of the application of the applied bibliographic standard.
![]()
This work is licensed under a Creative Commons Attribution-NonCommercial 4.0
International license.
Copyright (c) 2022 María de los Ángeles Zamora
Fernández, Julia Azanza Ricardo, Arnoldo Bezanilla Morlot.