Cuban Journal of Forest Sciences. 2021; May-August 9(2):205-225
![]()
Assessment of deforestation in sub-tropical forest using spatio-temporal landsat data
Evaluación de la deforestación en bosques subtropicales utilizando datos de terrenos espacio-temporales
Avaliação do desmatamento em florestas subtropicais utilizando dados espacio-temporais do terreno
Syed Hassan Raza1*![]() https://orcid.org/0000-0002-1318-7818
https://orcid.org/0000-0002-1318-7818
Muhammad Irfan Ashraf1![]() https://orcid.org/0000-0003-0704-5087
https://orcid.org/0000-0003-0704-5087
Areeba Binte Imran1![]() https://orcid.org/0000-0003-3882-717X
https://orcid.org/0000-0003-3882-717X
Ishfaq Ahmad Khan2![]() https://orcid.org/0000-0002-9614-6703
https://orcid.org/0000-0002-9614-6703
Syed Ghayoor Ali Shah1![]() https://orcid.org/0000-0002-7493-7264
https://orcid.org/0000-0002-7493-7264
1Department of Forestry and Range Management, PMAS Arid Agriculture University, Rawalpindi, 46300, Pakistan.
![]()
2Department of Forest Science & Biodiversity, Faculty of Forestry and Environment, University Putra Malaysia, UPM Serdang, Selangor 43400, Malaysia.![]()
*Corresponding author: syedhassanraxa@gmail.com
Received: 05/02/2021
Approved: 26/05/2021
ABSTRACT
The present research evaluated spatio-temporal change in the sub-tropical forest of district Malakand through Remote Sensing and GIS techniques. The main objective was to identify different land cover classes and to determine temporal changes in forest cover in the study area. This study was based on the two different classification techniques for the land cover classification. In this study, four Landsat images were acquired with the interval of 10 years from 1988 to 2018. The maximum likelihood classification and Minimum distance classification was applied on all the four images step by step. The total area of district Malakand was recorded as 975.32 km2. Regarding percent wise area coverage Forest covered 22.1 % of the total area while other classes' settlements, agriculture, barren land and water have covered 17.7, 23.3, 33 and 3.9% respectively in 1988. Whereas in 2018, percent wise area coverage forest covered 9.3 % of the total area although other classes settlements, agriculture, barren land and water have covered 33.8, 22.3, 31.8 and 3.7 respectively. The change in forest area over the time was 60.4 km2 which is equal to 6.2 % during 1998 to 2008 and ultimately overall deforestation was 124.4 km2 which is equal to 12.7 % loss of forest area lost from 1998 to 2018. Thus, the forest area was changed to settlements and barren lands from 1988 to 2018. Normalized Difference Vegetation Index (NDVI) was calculated for 1988, 1998, 2008 and 2018. Based on NDVI analysis, total deforestation over the time was 166.29 km2 in last 30 years (1988-2018) with percent deforestation of 43.66 % area lost. The Landsat images have 30 meters resolution and small forest area changes can not detected by Landsat images, thus high-resolution products can detect more deforestation comparatively.
Keywords: Deforestation; Spatio-temporal analysis; Landsat, Supervised Classification; NDVI.
RESUMEN
La presente investigación evaluó el cambio espacio-temporal en el bosque subtropical del distrito de Malakand mediante técnicas de teledetección y SIG. El objetivo principal era identificar las diferentes clases de cobertura del suelo y determinar los cambios temporales de la cobertura forestal en el área de estudio. Este estudio se basó en dos técnicas de clasificación diferentes para la clasificación de la cubierta del suelo. En este estudio, se adquirieron cuatro imágenes Landsat con un intervalo de 10 años desde 1988 hasta 2018. La clasificación de máxima verosimilitud y la clasificación de mínima distancia se aplicaron a las cuatro imágenes paso a paso. La superficie total del distrito de Malakand se registró como 975,32 km2. En lo que respecta a la cobertura porcentual de la superficie, el bosque cubrió el 22,1 % de la superficie total, mientras que los asentamientos, la agricultura, las tierras baldías y el agua cubrieron el 17,7, el 23,3, el 33 y el 3,9 % respectivamente en 1988. Durante el año 2018, el bosque cubrió el 9,3 % de la superficie total, así también los asentamientos de otras clases, la agricultura, la tierra estéril y el agua han cubierto el 33,8, 22,3, 31,8 y 3,7 respectivamente. El cambio en la superficie forestal a lo largo del tiempo fue de 60,4 km2, lo que equivale a un 6,2 % durante el período 1998-2008 y, en última instancia, la deforestación global fue de 124,4 km2, lo que equivale a una pérdida del 12,7 % de la superficie forestal perdida entre 1998 y 2018. Por lo tanto, la superficie forestal se transformó en asentamientos y tierras baldías de 1988 a 2018. Se calculó el índice de vegetación de diferencia normalizada (NDVI) para 1988, 1998, 2008 y 2018. Según el análisis del NDVI, la deforestación total a lo largo del tiempo fue de 166,29 km2 en los últimos 30 años (1988-2018), con un porcentaje de deforestación del 43,66 % de superficie perdida. Las imágenes Landsat tienen una resolución de 30 metros y los cambios en las áreas forestales pequeñas no pueden ser detectados por las imágenes Landsat, a diferencia de los productos de alta resolución que pueden detectar más deforestación en comparación.
Palabras clave: Deforestación; Análisis espacio-temporal; Landsat, Clasificación supervisada; NDVI.
RESUMO
A presente pesquisa avaliou a mudança espaço-temporal na floresta subtropical do distrito de Malakand através de técnicas de Sensoriamento Remoto e GIS. O principal objetivo era identificar diferentes classes de cobertura terrestre e determinar as mudanças temporais na cobertura florestal na área de estudo. Este estudo foi baseado nas duas diferentes técnicas de classificação da cobertura do solo. Neste estudo, quatro imagens Landsat foram adquiridas com o intervalo de 10 anos, de 1988 a 2018. A classificação de máxima probabilidade e a classificação de distância mínima foram aplicadas passo a passo em todas as quatro imagens. A área total do distrito de Malakand foi registrada como 975,32 km2. Em relação à porcentagem de cobertura de área sábia, a floresta cobriu 22,1 % da área total, enquanto os assentamentos de outras classes, agricultura, terra árida e água cobriram 17,7, 23,3, 33 e 3,9% respectivamente em 1988. Enquanto que em 2018, a porcentagem de cobertura de área razoável abrangia 9,3 % da área total, embora os assentamentos de outras classes, a agricultura, a terra árida e a água tenham coberto 33,8, 22,3, 31,8 e 3,7, respectivamente. A mudança na área florestal ao longo do tempo foi de 60,4 km2 que é igual a 6,2 % durante 1998 a 2008 e finalmente o desmatamento total foi de 124,4 km 2 que é igual a 12,7% de perda de área de floresta perdida de 1998 a 2018. Assim, a área florestal foi mudada para assentamentos e terras áridas de 1988 a 2018. O Índice de Vegetação com Diferença Normalizada (NDVI) foi calculado para 1988, 1998, 2008 e 2018. Com base na análise do NDVI, o desmatamento total ao longo do tempo foi de 166,29 km 2 nos últimos 30 anos (1988-2018) com percentual de desmatamento de 43,66 % de área perdida. As imagens Landsat têm resolução de 30 metros e pequenas mudanças de área florestal não podem ser detectadas pelas imagens Landsat, assim, produtos de alta resolução podem detectar mais desmatamento comparativamente.
Palavras-chave: Desmatamento; Análise espaço-temporal; Landsat; Classificação supervisionada; NDVI.
INTRODUCTION
Deforestation is the complete clearance of forest vegetation and their substitute by non-forest land cover (Philippe & Karume, 2019; Kemppinen et al., 2020). Forest play important roles in soil nutrient absorption (Nitschke et al., 2017) and worked as carbon sinks because trees absorbing CO2 and decrease the pressure of global warming on the environment (Zhao et al., 2019). After the industrial revolution, CO2 concentration in the atmosphere is increasing in a very rapid pace (Ussiri & Lal, 2017). This increasing concentration of CO2 significantly contributing to global warming and hence causing climate change, increasing frequency and magnitude of floods, droughts, heat wave and pollution etc., thus affects human life (Nda et al., 2018). Forests are also contributing in provision of clean drinking water (Westling et al., 2020), regular water flow and filtering pollutants, enhancing air and water quality (Davies et al., 2017). Direct and indirect are two main drivers which may cause deforestation of different nature including ecological, social pressure, commercial and biophysical factors interacting in complex manner ultimately results loss of vegetation. Direct drivers of deforestation may be natural as well as anthropogenic. Natural direct drivers may include damage caused by heavy floods, areas burnt by forest fires, infestation or attack by parasites or predators and hurricanes. On the other hand; anthropogenic direct drivers may include clearing of forest for agriculture, breeding of livestock, extraction of commercial timber, excessive logging, fuel wood collection, exploitation of forests for mining activities, infrastructure and construction of dams (Batar et al., 2017; Behera et al., 2019). Indirect drivers are a complex interaction of economic, governance, technological, and demographic activities (Kessy et al., 2016; Tegegne et al., 2016). Indirect causes of deforestation may also include lack of political actions (Carr, 2007), failure of policy and governance (insufficient tenure system, fraud and incorrect public administration), social pressure, military environmental terrorism and adverse impact of climate change (Chakravarty et al., 2012; Sonter et al., 2017).
Remote sensing has been extensively used to know community development, desertification (Kouba et al., 2018) and deforestation (Meshesha et al., 2016). Globally, remote sensing is widely used to monitor the forest cover spatiotemporally to understand forest degradation (Khan et al., 2016) and its impacts on climate, human life and biological diversity (Van der Sande et al., 2017; Yu et al., 2020). Since the launch of Landsat program in 1972, has been widely used for investigating natural resources management such as forest cover mapping (Phiri & Morgenroth, 2017; Wulder et al., 2016). Forest analyses, direction), and spatial pattern of land use change detection can be possible through GIS and remote sensing (Islam et al., 2018; Shawul et al., 2019).
Pakistan has diverse climatic conditions because of which there are different types of forest in the region (Khan et al., 2018). Coniferous forests are is mainly situated in northern areas of Khyber Pukhtunkhwa (KP), northern Punjab, Balochistan and Kashmir (AJK) region. These forests are found at altitudes 1,000 to 4,000 meters above mean sea level (Ali et al., 2018; Ali et al., 2019). In KP, these forests are mainly present in district Dir, Malakand, Swat and Mansehra, while in Punjab it can be found in district Rawalpindi (Bukhari et al., 2019; Ali et al., 2020). Furthermore, these forests provide supply of fuel wood, wildlife, erosion control, flood protection and timber for construction (Qamer et al., 2016; Zeb et al., 2019). In district Malakand, conifer species (Pinus roxburghii and Pinus wallichaina) of Sub-tropical Chirpine and Ecotone have significant environmental, socioeconomic and biological role. It supports tourism industry, wildlife habitats and has high potential of timber production (Khan & Ullah, 2016). The forest area facing serious challenges like encroachment, lack of land use planning and awareness in the community, deforestation and conversion forest to Barren land (Ali et al., 2017).
Forest cover areas in District Malakand have gone under rapid transformations. However, Billion Tree Afforestation Project (BTAP) is forest conservation programme of Khyber Pakhtunkhwa Provincial Government in Pakistan which has been started in 2014 and completed in 2019. Under BTAP, afforestation activities were conducted in different areas in district Malakand which restored and increased vegetation cover slightly. The present research evaluated spatio-temporal change in the sub-tropical forest of district Malakand through Remote Sensing and GIS techniques. The main objective was to identify different classes of land use, land cover and determine temporal forest cover change (spatial distribution) in the study area.
MATERIALS AND METHODS
Study Area
Malakand is bounded on the north by Lower Dir district, on the east by the district of Buner, on the south-east by Mardan district and south-west by Charsadda district and Mohmand Agency. It is also bounded by a range of mountains on the north-east separating it from district Swat and another range of mountains to the west separating it from Bajaur and Mohmand agencies. The soil of Malakand is generally loamy and moist, Stone gravelly, and rock lands and is irrigated by the Swat River, which flows from Swat and joins the river Kabul near Peshawar. The mean annual precipitation of the study area range from 600 to 650 mm which is not enough; therefore, the soil requires artificial irrigation (Khan et al., 2017). The climate here is moderately cold in winters and pleasant in summers. Moreover, the highest temperature (43°C) has been recorded in the month of June and July whereas the lowest temperature (-3°C) may be recorded in winter (in December and January).
Supervised classification of the satellite images of district Malakand and field-based survey were carried out to analyses the forest cover change in study area District Malakand. Remote sensing method used was to analyze forest cover change dynamics in the study area. The maximum likelihood and maximum distance method of supervised classification were examined for all Landsat images (from 1998 to 2018). After the image classification clearly, compared the resulting maps on a pixel-by-pixel basis by means of a change detection matrix. The flowing steps were conducted for procedure of image processing; (1) Data preparation which included correction done in software namely Environment for Visualizing Images (ENVI 5.3) and Sentinel Application Platform (SNAP), (3) Supervised image classification using training data sets taken for forest department, (4) Analysis after classification for forest cover lost during 1998-2018 (5) Preparation of change detection maps. These applications were carried out using ENVI and ArcGIS 10.3 software. For change detection over a period of time temporal satellite imagery were used of same time period and same season. Landsat Satellite images of four times (1988, 1998, 2008 & 2018) were downloaded (http://glovis.usgs.gov/).
In order to reduce computation time, different bands of Landsat images were combined and stacking has been done in ENVI 5.3. In Landsat 5 there were seven bands these bands were stacked to make a composite satellite image. A study area was specified using area of interest (AOI) option in the subset interface and subsets were ready after the job status completion. Maximum likelihood technique was used to categorize the pixels. It is a classification system in which unidentified pixels are allocated to classes using outline of likelihood around training areas using the maximum-likelihood statistic. Furthermore, NDVI was determined that ranges from (-1) to (+1); though, no green leaves gives a value near to zero. A value of zero means no flora and near to +1 (0.8 - 0.9) shows the maximum probable density of green leaves. After all the classification of all maps they were reclassified into desired forest cover classes by using reclassification tool in ArcGIS 10, raster calculation option was used to measure the particular area. Images were also be prepared of all the land cover types for each year of the study area.
RESULTS
This study is based on the two different classification techniques for the land cover classification. In this study we have taken images with the interval of 10 years from 1988 to 2018. Four images of 1988, 1998, 2008 and 2018 were taken and 1st those images were preprocessed and all the images are shown in figure 4.1. These images are 1st corrected radio metrically and then IAR correction were applied and then Dark Subtraction was applied to able the image for the further processing.
Supervised Classification
The maximum likelihood classification and minimum distance classification was applied on all the four images step by step. The classified image is shown in Figure 1 and Table 1 described the covered areas and percentages by each class in 1988 Landsat-8. The total area of district Malakand was recorded as 975.32 km2. The highest land cover area was Agriculture 227.6 (km2) while the lowest area (37.7 km2) was covered by water. Forest area was 215.2 km2 extended over central and northern part of the district. The remaining areas covered by Settlements and Barren Land were 173 km2 and 321.5 km2. Regarding percentage distribution of area, forests covered 22.1 % of the total area while other class settlements, agriculture, barren land and water have covered 17.7, 23.3, 33 and 3.9 respectively.
Table 1. - Classes area and percentages of 1998, 1998, 2008 and 2018
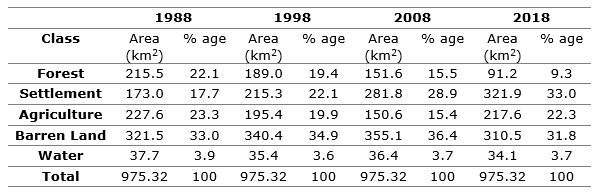
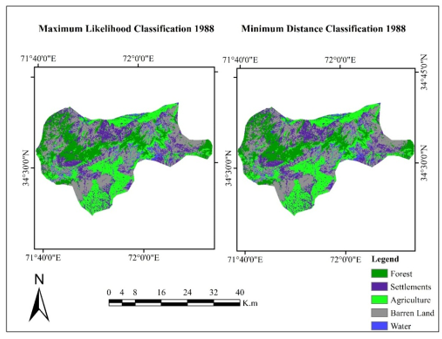
Figure 1. - Classification classes 1988
In the classified images of 1998, agriculture covered much area throughout the study area especially near the rivers and northward sides (Figure 2). The highest land cover area was barren lands 340.4 km2 while the lowest area 35.4 km2 was covered by water. Forest area was 189 km2 extended over central and northern part of the district. The remaining areas covered by Settlements and Agriculture were 215.3 km2 and 195.4 km2. Regarding percentage distribution of area, forests covered 19.4 % of the total area while other classes settlements, agriculture, barren land and water have covered 22.1, 19.9, 34.9 and 3.7 respectively. The change in forest area over the time was 26.5 km2 which is equal to 2.7 percent during 1988 to 1998 (Table 1).
Similarly, in the classified images of 2008, the maximum likelihood classifier shows the high rate of forest as compare to minimum distance classifier (Figure 3). In both images in north direction there is high rate of agriculture area.
According to Table 1, the highest land cover area was barren lands which covered 355.1 km2 indicating increases in the barren area as compared to 1998. The lowest area 35.4 km2 was covered by water. Forest area was 151 km2 extended over central and northern part of the district. The remaining areas covered by Settlements and Agriculture were 281.8 km2 and 150.4 km2. Regarding percent wise area coverage forest covered 15.4 % of the total area while other class settlements, agriculture, barren land and water have covered 28.9, 15.4, 36.4 and 3.7 respectively. The change in forest area over the time was 37.4 km2 which is equal to 3.9 percent during 1998 to 2008 while during two decades 1988 to 2008 deforested area was 64 km2 which is equal to 6.6 percent of area lost during this period.
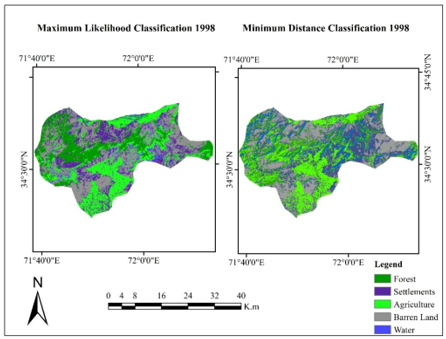
Figure 2. - Classification classes 1998
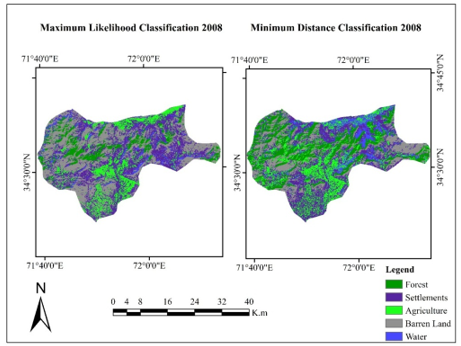
Figure 3. - Classification classes 2008
Lastly, in the classified images of 2018 from Landsat-8 image, it can be seen that settlement has increase exponentially during 1998 to 2008 and forest has gradually decreased in this last 10 years (Figure 4). In these classified images the barren land has been increased and there is drastic decrease in forest area. The barren land is also increased in the area.
According to Table 1, the highest land cover area was settlements which covered 321.9 km2 indicating increase in the barren area as compared to 1998. The lowest area 35.4 km2 was covered by water. Forest area was decreased to 91.2 km2 extended over central part of the district. The remaining areas covered by barren lands and Agriculture were 310.5 km2 and 217.6 km2. Regarding percent wise area coverage forest covered 9.3 % of the total area while other class settlements, agriculture, barren land and water have covered 33.8, 22.3, 31.8 and 3.7 respectively.
The change in forest area over the time was 60.4 km2 which is equal to 6.2 percent during 1998 to 2008 while overall deforestation was 124.4 km2 which is equal to 12.7 percent loss of forest area lost from 1998 to 2018. The area wise chart is shown in the area (Figure 4). We can see that forest is deceased in every decade. On the other hand, the settlement is increased with the passage of time. Thus, the forest area was changed to settlements and barren lands from 1988 to 2018 (Figure 5).
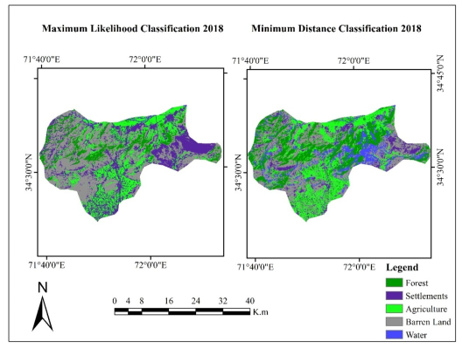
Figure 4. - Classification classes 2018
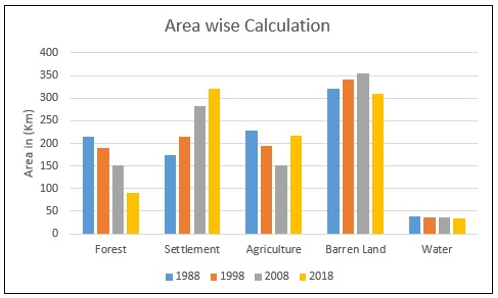
Figure 5. - Area wise classes during 1988-2018
Accuracy assessment
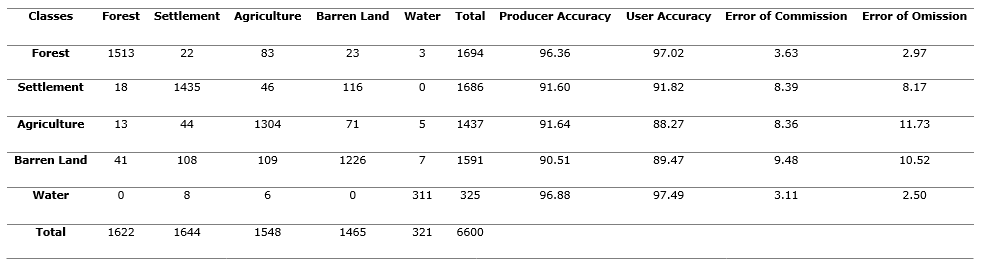
As it is important that the post classified image should be validate. With the help of accuracy assessment both the classifiers were also tested. It is observed that the results of maximum likelihood classifier were more accurate as compare to minimum distance classifier. The accuracy assessment table of maximum likelihood is shown in Table 2. Here from this table we can identify that the overall accuracy from ML classifier was 92.4 % with Kappa coefficient of 0.81. From the minimum distance classifier, the overall accuracy was 87 % and the Kappa coefficient was 0.76. Therefore, from those results and accuracy assessment tables it is proven that Maximum likelihood classifier is best for land cover classification. The table generated from minimum distance classification (Table 3).
Table 2. - Accuracy assessment table of maximum likelihood
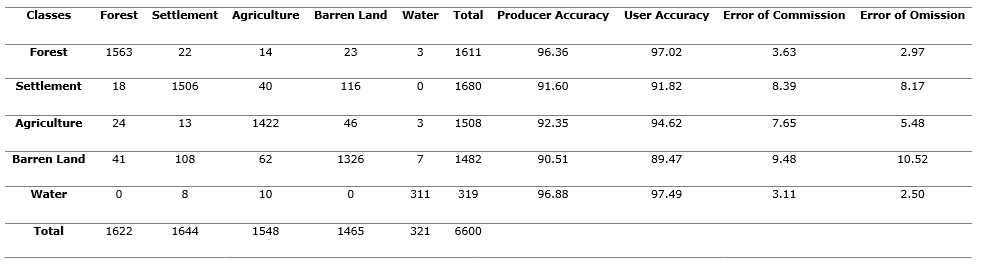
Table 3. - Accuracy assessment of maximum distance
NDVI Analysis
Normalized Difference Vegetation Index (NDVI) was calculated for 1988, 1998, 2008 and 2018 (Table 4). NDVI outputs computed from Landsat images of study area for the year 1998 and 2018 have been shown in Figure 6. Regarding forest cover analysis through NDVI, normally some higher NDVI values were in same range for agriculture areas and forest areas. These forest areas values are bit lower than NDVI in 2018 and 2008. These agriculture-based values were kept in consideration. According to Table 4, 1988 the NDVI based forest area was 380.79 km2 which is equal to 423110 pixel value of Landsat-5 image while the area id reduced to 327.89 km2 in 1998. Further deforestation was evident from 2008 and 2018 NDVI which showed forest areas as 255.57 km2 and 214.50 km2 respectively. The area changes for the base year 1988 were; deforestation from 1988 to 1998 was 52.90 km2, next from 1998 to 2008 the deforestation was 72.32 km2m and lastly from 2008 to 2018 forest area has been reduced 41.06.km2. Regarding percent change with the base year 1988, the percent changes were; 13.89 % for 1988-1998, 22.05 for 1998-2008 and 16.06% for 2008-2018. Total deforestation over the time was 166.29 km2 in last 30 years (1988-2018) with percent deforestation of 43.66 % area lost.
Table 4. - Temporal Analysis of NDVI analysis (1988-2018)
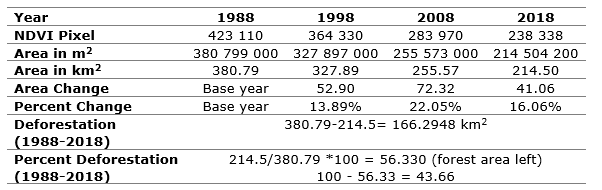
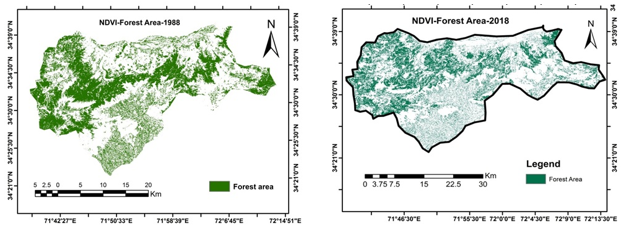
Figure 6. - Normalized Difference Vegetation Index 1988 and 2018
Plantation under afforestation project in district Malakand
Under Billion Tree Afforestation Project (BTAP), provincial forest department has planted thousands of native plants over a large-area in district Malakand. There are about 29 plantation areas in the study area and the increase in forest due to BTAP intervention has been assessed through vegetation indices. Ratio Vegetation Index (RVI) is ratio between Near Infrared and Red portion of the spectrum because of its importance in photosynthesis. The range of RVI is form 0 to infinity, less than zero shows vegetation while higher values shows vegetation less areas. Soil Adjusted Vegetation Index SAVI overcome the soil interference in the reflectance values by considering the soil factor, that's why can SAVI can used in combination to NDVI. SAVI has same range similar NDVI. The DVI also consider slope of the soil line and weigh Near Infrared to differentiate vegetation areas from non-vegetated areas. The values range from negative to positive values, vegetation are expressed by positive values. Plantations shape file created via ArcGIS 10.3 was overlaid on corresponding vegetation indices of both all acquired images. The masked pixels values were extracted for all the indices and were arranged properly into excel sheets. Result of all vegetation indices showed significant increase in vegetation cover due to plantation program in the study area (Figure 7).
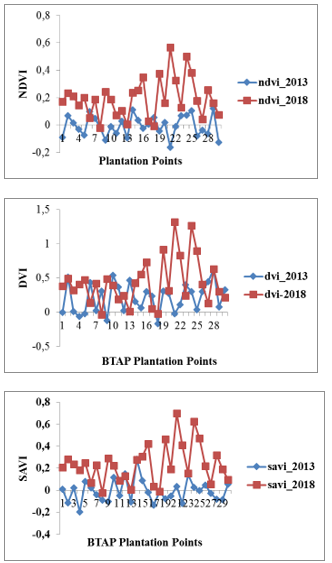
Figure 7. - NDVI, DVI and SAVI for BTAP Plantation Points
DISCUSSION
Forests has significant environmental, socioeconomic and biological role but forest area in Pakistan facing serious challenges like encroachment, lack of land use planning and awareness in the community, deforestation and conversion forest to Barren land. Forest cover areas in District Malakand have gone under rapid transformations. Mahboob et al., (2016) reported from their studied of land-use changes in Islamabad that urbanization has increased between 1975 and 2010 from 50km2 to 332km2, which has ultimately resulted in alarming reduction of forest area from 465km2 to 145km2 including Margalla Hills National Park. Similarly, Batool and Kanwal Javaid (2018) used Landsat-7 and Landsat-8 to discover the land-use changes in Margalla Hills National Parks, Islamabad between 2000 and 2008. They identified 13 % deforestation with 2 % increase in construction.
Mitchell et al., (2014) stated that Pakistan has greater rural area where people mostly count on natural resources. Furthermore, there are numerous forest product-based industries relying on forest. Forests offer different ecosystem services for the local people. Though, developmental activities attract more tourists to these forests but it greatly effects and disturb the forest ecosystem (Sheday et al., 2019). Siyal et al. (2016) studied the spatial and temporal difference in the forest cover of the Pai forest in Sindh using land surface temperature using optical and thermal Landsat satellite data (1987-2014). The study showed 15 % of deforestation in thin forest in just 5 years (1987-1992) while 26 % increase was recorded in thick forest cover in a span of about 21 years (1992-2013). It was analyzed that most of forested area has been cleared in 1992.
Rashid & Iqbal, (2018) studied forest cover dynamics during 1990- 2016 using Landsat images along Karakoram Highway. The forest cover change maps of the five land-use based classified study area (forest, vegetation, urban, open land and snow cover) detect 26 % decline in the forest cover in duration of 26 years. Urban expansion and vegetation replacement was reported as the main cause of forest cover declination. In this context, various studies concluded that rapid urban expansion and agricultural encouragement are the two main factors causing forest cover reduction (Gilani et al., 2015; Sajjad et al., 2015; Qamer et al., 2016; Khalid et al., 2016; Kundu, 2017). Additionally, illegal logging is also an element of forest degradation in developing countries (Khalid et al., 2016; Qamer et al., 2016). In this context, the pressure of local community on these forests for wood consumption it is projected that the forest of Malakand and Hazara may no longer exist by the year 2027. Rangelands, agriculture and plantations fulfill about 21 % of the total needs. But the supply gap of 8.8 million m 3 by 2027 is expected to reach out to 13.6 million m3 by 2050 (Rashid & Iqbal, 2018).
Due to land use changes and expansion in urban areas, increases in forest degradation occur in Abbottabad to Besham in Khyber Pakhtunkhwa. Changing these lands into pastures, parkland and agricultural vegetation increase the aesthetic value but are vulnerable to intense grazing and ultimately cause degradation. Local community demand for wood is another factor of forest degradation (Fischer et al., 2010; Ali et al., 2006; Rashid & Iqbal, 2018).
Kausar et al., (2016) used Landsat images detect LULC change due to the enhanced activities of ecotourism during 1998-2010. The study reported that the Built-up area have increased by 11.73%, reserve forest by 8.11% while grassland and dense natural forest decreases by 7.50 and 12.37 % respectively. Similarly, Urooj and Ahmad, (2019) conducted spatio-temporal analysis of ecological changes around wetland in AJK. The study revealed remarkable increase in built-up area, while reduction in water body, vegetation and barren area was observed from 1992 to 2013. In another study, researchers concluded that rapid increasing in the agricultural land area is one main cause of forest decline (Qasim et al., 2011). Tang et al., (2005) stated that main drivers behind forest decline were urban development and settlements. Similarly, Awasthi et al., (2002) and Twumasi & Merem, (2006) described the trend of forest declining in the watershed area around the world. Moreover, Landsat images have 30 meters resolution and small forest area changes can not detected by Landsat images, thus high resolution images can detect more deforestation comparatively. Spot-5/6/7 and Worldview 2/3 can implement for detailed deforestation. Fusion of Sentinel-2, Sentienl-1 and SAR/Radar imagery can enhanced the results. Results can be compared with Global 1km Lidar Forest Canopy Height maps and Global Forest Cover Change 2000-2017 datasets.
CONCLUSION
This study was based on the two different classification techniques for the land cover classification. In this study have taken images with the interval of 10 years from 1988 to 2018. The maximum likelihood classification and minimum distance classification were applied on all Landsat images.
The total area of district Malakand was recorded as 975.32 km2. Regarding percent wise area coverage Forest covered 22.1 % of the total area while other classes' settlements, agriculture, barren land and water have covered 17.7, 23.3, 33 and 3.9 respectively in 1988. Whereas in 2018, percent wise area coverage forest covered 9.3 % of the total area while other classes settlements, agriculture, barren land and water have covered 33.8, 22.3, 31.8 and 3.7 respectively.
The change in forest area over the time was 60.4 km2 which is equal to 6.2 percent during 1998 to 2008 while overall deforestation was 124.4 km2 which is equal to 12.7 percent loss of forest area lost from 1998 to 2018. The forest area was changed to settlements and barren lands from 1988 to 2018. Normalized Difference Vegetation Index (NDVI) was calculated for the three decades (1988- 2018) and results showed total deforestation of 166.29 km2 with percent deforestation of 43.66 % area lost.
REFERENCES
ALI, A., ASHRAF, Dr.I., GULZAR, S. y AKMAL, M., 2020. Estimation of forest carbon stocks in temperate and subtropical mountain systems of Pakistan: implications for REDD+ and climate change mitigation. Environmental Monitoring and Assessment [en línea], vol. 192, no. 3, pp. 1-13. DOI 10.1007/s10661-020-8157-x. Disponible en: https://www.researchgate.net/publication/339541526_Estimation_of_forest_carbon_stocks_in_temperate_and_subtropical_mountain_systems_of_Pakistan_implications_for_REDD_and_climate_change_mitigation
ALI, A., ASHRAF, Dr.I., GULZAR, S., AKMAL, M. y AHMAD, B., 2019. Estimation of soil carbon pools in the forests of Khyber Pakhtunkhwa Province, Pakistan. Journal of Forestry Research [en línea], vol. 31, no. 1, pp. 1-9. DOI 10.1007/s11676-019-01059-9. Disponible en: https://www.researchgate.net/publication/336673520_Estimation_of_soil_carbon_pools_in_the_forests_of_Khyber_Pakhtunkhwa_Province_Pakistan.
ALI, A., ULLAH, S., BUSHRA, S., AHMAD, N. y KHAN, M.A., 2018. Quantifying forest carbon stocks by integrating satellite images and forest inventory data. Austrian Journal of Forest Science [en línea], vol. 135, no. 2, pp. 93-118. Disponible en: https://www.researchgate.net/publication/327174541_Quantifying_forest_carbon_stocks_by_integrating_satellite_images_and_forest_inventory_data.
ALI, S., ALI, W., NADEEM, M., KHAN, A., RAHMAN, Z. y IQBAL, A., 2017. Forest cover change and carbon stock assessment in Swat valley using remote sensing and geographical information systems. Pure and Aplied Biology [en línea], vol. 6, no. 3, pp. 850-856. DOI 10.19045/bspab.2017.60089. Disponible en: https://www.researchgate.net/publication/318502849_Forest_cover_change_and_carbon_stock_assessment_in_Swat_valley_using_remote_sensing_and_geographical_information_systems
AWASTHI, K.D., SITAULA, B.K., SINGH, B.R. y BAJACHARAYA, R.M., 2002. Land-use change in two Nepalese watersheds: GIS and geomorphometric analysis. Land Degradation & Development [en línea], vol. 13, no. 6, pp. 495-513. [Consulta: 4 mayo 2021]. ISSN 1099-145X. DOI https://doi.org/10.1002/ldr.538. Disponible en: https://onlinelibrary.wiley.com/doi/abs/10.1002/ldr.538.
BADSHAH BUKHARI, S.S., BAJWA, G.A. y REHMAN, S.S., 2019. Climate-Growth Response Function of the Blue Pine (Pinus Wallichiana) in Galies Forest Division-Abbottabad, KP, Pakistan. Sarhad Journal of Agriculture [en línea], vol. 35, no. 1, pp. 116-125. [Consulta: 4 mayo 2021]. Disponible en: https://researcherslinks.com/current-issues/Climate-Growth-Response-Function-of-the-Blue-Pine-Pinus-Wallichiana-in-Galies-Forest-Division-Abbottabad-KP-Pakistan/14/1/2004/figures
BATAR, A., WATANABE, T. y KUMAR, A., 2017. Assessment of Land-Use/Land-Cover Change and Forest Fragmentation in the Garhwal Himalayan Region of India. Environments [en línea], vol. 4, no. 2, pp. 34. DOI 10.3390/environments4020034. Disponible en: https://www.researchgate.net/publication/316273164_Assessment_of_Land-UseLand-Cover_Change_and_Forest_Fragmentation_in_the_Garhwal_Himalayan_Region_of_India.
BEHERA, M.D., TRIPATHI, P., DAS, P. y SRIVASTAV, S.K., 2018. Remote sensing based deforestation analysis in Mahanadi and Brahmaputra river basin in India since 1985. Journal of Environmental Management [en línea], vol. 206, pp. 1192-1203. [Consulta: 4 mayo 2021]. DOI 10.1016/j.jenvman.2017.10.015. Disponible en: https://www.researchgate.net/publication/321123158_Remote_sensing_based_deforestation_analysis_in_Mahanadi_and_Brahmaputra_river_basin_in_India_since_1985.
CARR, F., 2007. Government decision-making and environmental degradation: a study relating to mining activities in Papua New Guinea [en línea]. Doctoral dissertation. S.l.: Murdoch University. Disponible en: https://researchrepository.murdoch.edu.au/id/eprint/502/1/01Front.pdf.
CHAKRAVARTY, S., GHOSH, S., SURESH, C., DEY, A. y SHUKLA, G., 2012. Deforestation: Causes, Effects and Control Strategies [en línea]. S.l.: s.n. ISBN 978-953-51-0569-5. Disponible en: https://www.intechopen.com/books/global-perspectives-on-sustainable-forest-management/deforestation-causes-effects-and-control-strategies.
DAVIES, H.J., DOICK, K.J., HUDSON, M.D. y SCHRECKENBERG, K., 2017. Challenges for tree officers to enhance the provision of regulating ecosystem services from urban forests. Environmental Research [en línea], vol. 156, pp. 97-107. [Consulta: 4 mayo 2021]. ISSN 0013-9351. DOI 10.1016/j.envres.2017.03.020. Disponible en: https://www.sciencedirect.com/science/article/pii/S0013935117304942.
ISLAM, K., JASHIMUDDIN, M., NATH, B. y NATH, T.K., 2018. Land use classification and change detection by using multi-temporal remotely sensed imagery: The case of Chunati wildlife sanctuary, Bangladesh. The Egyptian Journal of Remote Sensing and Space Science [en línea], vol. 21, no. 1, pp. 37-47. [Consulta: 4 mayo 2021]. ISSN 1110-9823. DOI 10.1016/j.ejrs.2016.12.005. Disponible en: https://www.sciencedirect.com/science/article/pii/S1110982316301594.
KAUSAR, R., BAIG, S. y RIAZ, I., 2016. Spatio-temporal land use/land cover analysis of Murree using remote sensing and GIS. Asian Journal of Agriculture and rural Development [en línea], vol. 6, no. 3, pp. 50-58. [Consulta: 4 mayo 2021]. Disponible en: https://ideas.repec.org/a/asi/ajosrd/2016p50-58.html.
KEMPPINEN, K.M.S., COLLINS, P.M., HOLE, D.G., WOLF, C., RIPPLE, W.J. y GERBER, L.R., 2020. Global reforestation and biodiversity conservation. Conservation Biology [en línea], vol. 34, no. 5, pp. 1221-1228. Disponible en: https://pubmed.ncbi.nlm.nih.gov/32017194/
KESSY, J.F., NSOKKO, E., KASWAMILA, A. y KIMARO, F., 2016. Analysis of Drivers and Agents of Deforestation and Forest Degradation in Masito Forests, Kigoma, Tanzania. International Journal of Asian Social Science [en línea], vol. 6, no. 2, pp. 93-107. [Consulta: 4 mayo 2021]. Disponible en: https://ideas.repec.org/a/asi/ijoass/2016p93-107.html.
KHALID, S. ur R., KHAN, M.R., USMAN, M., YASIN, M.W. y IQBAL, M.S., 2016. Spatiotemporal Monitoring for Deforestation and Forest Degradation Activities in Selected Areas of Khyber Pakhtunkhwa (KPK). International Journal of Geosciences [en línea], vol. 7, no. 10, pp. 1191-1207. [Consulta: 4 mayo 2021]. DOI 10.4236/ijg.2016.710089. Disponible en: http://www.scirp.org/Journal/Paperabs.aspx?paperid=71536.
KHAN, W., KHAN, S.M., AHMAD, H., ALQARAWI, A.A., SHAH, G.M., HUSSAIN, M. y ABD_ALLAH, E.F., 2018. Life forms, leaf size spectra, regeneration capacity and diversity of plant species grown in the Thandiani forests, district Abbottabad, Khyber Pakhtunkhwa, Pakistan. Saudi Journal of Biological Sciences [en línea], vol. 25, no. 1, pp. 94-100. [Consulta: 4 mayo 2021]. ISSN 1319-562X. DOI 10.1016/j.sjbs.2016.11.009. Disponible en: https://www.sciencedirect.com/science/article/pii/S1319562X16301668.
KOUBA, Y., GARTZIA, M., EL AICH, A. y ALADOS, C.L., 2018. Deserts do not advance, they are created: Land degradation and desertification in semiarid environments in the Middle Atlas, Morocco. Journal of Arid Environments [en línea], vol. 158, pp. 1-8. [Consulta: 4 mayo 2021]. ISSN 0140-1963. DOI 10.1016/j.jaridenv.2018.07.002. Disponible en: https://www.sciencedirect.com/science/article/pii/S0140196318304257.
MESHESHA, T.W., TRIPATHI, S.K. y KHARE, D., 2016. Analyses of land use and land cover change dynamics using GIS and remote sensing during 1984 and 2015 in the Beressa Watershed Northern Central Highland of Ethiopia. Modeling Earth Systems and Environment [en línea], vol. 2, no. 4, pp. 1-12. [Consulta: 4 mayo 2021]. ISSN 2363-6211. DOI 10.1007/s40808-016-0233-4. Disponible en: https://doi.org/10.1007/s40808-016-0233-4.
MUHAMMAD, Z., KHAN, N. y ULLAH, A., 2016. Quantitative Ethnobotanical Profile of Understory Vegetation in Acacia Modesta (Wall) Forests of Malakand Division, Pakistan. Science, Technology and Development [en línea], vol. 35, no. 2, pp. 88-93. DOI 10.3923/STD.2016.88.93. Disponible en: https://www.semanticscholar.org/paper/Quantitative-Ethnobotanical-Profile-of-Understory-Muhammad-Khan/06c36545fd271a2df5aa7d9fc9d4a6a26ac9f9ed.
NDA, M., ADNAN, M.S., AHMAD, K.A., USMAN, N., RAZI, M.A.M. y DAUD, Z., 2018. A Review on the Causes, Effects and Mitigation of Climate Changes on the Environmental Aspects. International Journal of Integrated Engineering [en línea], vol. 10, no. 4. [Consulta: 4 mayo 2021]. ISSN 2600-7916. Disponible en: https://publisher.uthm.edu.my/ojs/index.php/ijie/article/view/2269.
ITSCHKE, C.R., WAEBER, P.O., KLAASSEN, J.W., DORDEL, J., INNES, J.L. y APONTE, C., 2017. Nutrient uptake and use efficiency in co-occurring plants along a disturbance and nutrient availability gradient in the boreal forests of the southwest Yukon, Canada. Journal of Vegetation Science [en línea], vol. 28, no. 1, pp. 69-81. [Consulta: 4 mayo 2021]. ISSN 1654-1103. DOI https://doi.org/10.1111/jvs.12468. Disponible en: https://onlinelibrary.wiley.com/doi/abs/10.1111/jvs.12468.
PHILIPPE, M.T. y KARUME, K., 2019. Assessing Forest Cover Change and Deforestation Hot-Spots in the North Kivu Province, DR-Congo Using Remote Sensing and GIS. American Journal of Geographic Information System [en línea], vol. 8, no. 2, pp. 39-54. [Consulta: 4 mayo 2021]. ISSN 2163-114X. Disponible en: http://article.sapub.org/10.5923.j.ajgis.20190802.01.html.
PHIRI, D. y MORGENROTH, J., 2017. Developments in landsat land cover classification methods: A review. Remote Sensing [en línea], vol. 9, no. 9, pp. 967. [Consulta: 4 mayo 2021]. ISSN 2072-4292. Disponible en: https://jglobal.jst.go.jp/en/detail?JGLOBAL_ID=201802220882090078.
QAMER, F.M., SHEHZAD, K., ABBAS, S., MURTHY, M.S.R., XI, C., GILANI, H. y BAJRACHARYA, B., 2016. Mapping Deforestation and Forest Degradation Patterns in Western Himalaya, Pakistan. Remote Sensing [en línea], vol. 8, no. 5, pp. 385. [Consulta: 4 mayo 2021]. DOI 10.3390/rs8050385. Disponible en: https://www.mdpi.com/2072-4292/8/5/385.
QASIM, M., HUBACEK, K., TERMANSEN, M. y KHAN, A., 2011. Spatial and temporal dynamics of land use pattern in District Swat, Hindu Kush Himalayan region of Pakistan. Applied Geography [en línea], vol. 31, no. 2, pp. 820-828. [Consulta: 4 mayo 2021]. ISSN 0143-6228. DOI 10.1016/j.apgeog.2010.08.008. Disponible en: https://www.sciencedirect.com/science/article/pii/S0143622810001098.
SHAWUL, A.A. y CHAKMA, S., 2019. Spatiotemporal detection of land use/land cover change in the large basin using integrated approaches of remote sensing and GIS in the Upper Awash basin, Ethiopia. Environmental Earth Sciences [en línea], vol. 78, no. 5, pp. 141. [Consulta: 4 mayo 2021]. ISSN 1866-6299. DOI 10.1007/s12665-019-8154-y. Disponible en: https://doi.org/10.1007/s12665-019-8154-y.
SONTER, L., HERRERA, D., BARRETT, D., GALFORD, G., MORAN, C. y FILHO, B., 2017. Mining drives extensive deforestation in the Brazilian Amazon. Nature Communications [en línea], vol. 8. DOI 10.1038/s41467-017-00557-w. Disponible en: https://www.researchgate.net/publication/320472961_Mining_drives_extensive_deforestation_in_the_Brazilian_Amazon.
TANG, Z., ENGEL, B.A., PIJANOWSKI, B.C. y LIM, K.J., 2005. Forecasting land use change and its environmental impact at a watershed scale. Journal of Environmental Management [en línea], vol. 76, no. 1, pp. 35-45. [Consulta: 4 mayo 2021]. ISSN 0301-4797. DOI 10.1016/j.jenvman.2005.01.006. Disponible en: https://www.sciencedirect.com/science/article/pii/S0301479705000514.
TEGEGNE, Y.T., LINDNER, M., FOBISSIE, K. y KANNINEN, M., 2016. Evolution of drivers of deforestation and forest degradation in the Congo Basin forests: Exploring possible policy options to address forest loss. Land Use Policy [en línea], vol. 51, pp. 312-324. [Consulta: 4 mayo 2021]. ISSN 0264-8377. DOI 10.1016/j.landusepol.2015.11.024. Disponible en: https://www.sciencedirect.com/science/article/pii/S0264837715003877.
TWUMASI, Y.A. y MEREM, E.C., 2006. Management of watersheds with remote sensing and GIS: a case study of River Niger Delta Region in Nigeria. ASPRS 2006 Annual Conference [en línea]. Reno, Nevada: ASPRS, Disponible en: http://www.asprs.org/a/publications/proceedings/reno2006/0158.pdf
UROOJ, R. y AHMAD, S.S., 2019. Spatio-temporal ecological changes around wetland using multispectral satellite imagery in AJK, Pakistan. SN Applied Sciences [en línea], vol. 1, no. 7, pp. 714. [Consulta: 4 mayo 2021]. ISSN 2523-3971. DOI 10.1007/s42452-019-0748-1. Disponible en: https://doi.org/10.1007/s42452-019-0748-1.
USSIRI, D.A.N. y LAL, R., 2017. Introduction to Global Carbon Cycling: An Overview of the Global Carbon Cycle. En: D.A.N. USSIRI y R. LAL (eds.), Carbon Sequestration for Climate Change Mitigation and Adaptation [en línea]. Estados Unidos: Springer International Publishing, pp. 61-76. [Consulta: 4 mayo 2021]. ISBN 978-3-319-53845-7. Disponible en: https://doi.org/10.1007/978-3-319-53845-7_3.
VAN DER SANDE, M.T., POORTER, L., BALVANERA, P., KOOISTRA, L., THONICKE, K., BOIT, A., DUTRIEUX, L.P., EQUIHUA, J., GERARD, F., HEROLD, M., KOLB, M., SIMÕES, M. y PEÑA-CLAROS, M., 2017. The integration of empirical, remote sensing and modelling approaches enhances insight in the role of biodiversity in climate change mitigation by tropical forests. Current Opinion in Environmental Sustainability [en línea], vol. 26-27, pp. 69-76. [Consulta: 4 mayo 2021]. ISSN 1877-3435. DOI 10.1016/j.cosust.2017.01.016. Disponible en: https://www.sciencedirect.com/science/article/pii/S187734351730026X.
WESTLING, N., STROMBERG, P.M. y SWAIN, R.B., 2020. Can upstream ecosystems ensure safe drinking water—Insights from Sweden. Ecological Economics [en línea], vol. 169. [Consulta: 4 mayo 2021]. ISSN 0921-8009. DOI 10.1016/j.ecolecon.2019.106552. Disponible en: https://www.sciencedirect.com/science/article/pii/S0921800919306019.
WULDER, M.A., WHITE, J.C., LOVELAND, T.R., WOODCOCK, C.E., BELWARD, A.S., COHEN, W.B., FOSNIGHT, E.A., SHAW, J., MASEK, J.G. y ROY, D.P., 2016. The global Landsat archive: Status, consolidation, and direction. Remote Sensing of Environment [en línea], vol. 185, pp. 271-283. [Consulta: 4 mayo 2021]. ISSN 0034-4257. DOI 10.1016/j.rse.2015.11.032. Disponible en: https://www.sciencedirect.com/science/article/pii/S0034425715302194.
YU, J., LI, F., WANG, Y., LIN, Y., PENG, Z. y CHENG, K., 2020. Spatiotemporal evolution of tropical forest degradation and its impact on ecological sensitivity: A case study in Jinghong, Xishuangbanna, China. Science of The Total Environment [en línea], vol. 727, pp. 138678. [Consulta: 4 mayo 2021]. ISSN 0048-9697. DOI 10.1016/j.scitotenv.2020.138678. Disponible en: https://www.sciencedirect.com/science/article/pii/S0048969720321951.
ZEB, A., HAMANN, A., ARMSTRONG, G.W. y ACUNA-CASTELLANOS, D., 2019. Identifying local actors of deforestation and forest degradation in the Kalasha valleys of Pakistan. Forest Policy and Economics [en línea], vol. 104, pp. 56-64. [Consulta: 4 mayo 2021]. ISSN 1389-9341. DOI 10.1016/j.forpol.2019.04.005. Disponible en: https://www.sciencedirect.com/science/article/pii/S1389934118301849.
ZHAO, J., MA, J. y ZHU, Y., 2019. Evaluating impacts of climate change on net ecosystem productivity (NEP) of global different forest types based on an individual tree-based model FORCCHN and remote sensing. Global and Planetary Change [en línea], vol. 182, pp. 103010. [Consulta: 4 mayo 2021]. ISSN 0921-8181. DOI 10.1016/j.gloplacha.2019.103010. Disponible en: https://www.sciencedirect.com/science/article/pii/S0921818118307045.
Conflict of interests:
The authors declare not to have any interest conflicts.
Authors' contribution:
Syed Hassan Raza: Literature search and review, instrument making, instrument application, compilation of information resulting from the instruments applied, statistic analysis, preparation of tables, graphs and images,
database preparation.
Muhammad Irfan Ashraf: Conception of the idea, instrument application, compilation of information resulting from the instruments applied.
Areeba Binte Imran: Conception of the idea, general advice on the topic addressed, drafting of the original (first version), review and final version of the article, article correction.
Ishfaq Ahmad Khan: Compilation of information resulting from the instruments applied, statistic analysis, preparation of tables, graphs and images.
Syed Ghayoor Ali Shah: Conception of the idea, literature search and review, database preparation, general advice on the topic addressed.
![]()
This work is licensed under a Creative Commons Attribution-NonCommercial 4.0
International license
Copyright (c) 2021 Syed Hassan Raza, Muhammad Irfan Ashraf, Areeba Binte Imran, Ishfaq Ahmad Khan, Syed Ghayoor Ali Shah