Revista Cubana de Ciencias Forestales. 2020; mayo-agosto 8(2):
262-281![]()
Translated from the original in spanish
Identification of spectral and colorimetric reflectance patterns of dry wood of Peltogyne purpurea Pittier
Identificación de patrones de reflectancia espectral y colorimétricos en madera seca de Peltogyne purpurea Pittier
Identificação de padrões de refletância espectral e colorimétrica em madeira seca de Peltogyne purpurea Pittier
Juan Carlos Valverde1*![]() https://orcid.org/0000-0002-3181-1346
https://orcid.org/0000-0002-3181-1346
Dagoberto Arias Aguilar1![]() https://orcid.org/0000-0002-3056-9172
https://orcid.org/0000-0002-3056-9172
Kevin Arias2 ![]() https://orcid.org/0000-0001-9911-4515
https://orcid.org/0000-0001-9911-4515
Marvin Castillo2![]() https://orcid.org/0000-0003-1214-7029
https://orcid.org/0000-0003-1214-7029
Cornelia Miller3![]() https://orcid.org/0000-0001-6875-6910
https://orcid.org/0000-0001-6875-6910
Heileen Aguilar3![]() https://orcid.org/0000-0001-5838-3225
https://orcid.org/0000-0001-5838-3225
Daniel Flores3 ![]() https://orcid.org/0000-0001-5010-0083
https://orcid.org/0000-0001-5010-0083
1Laboratorio de Ecofisiología Forestal y Aplicaciones Ecosistémicas (ECOPLANT), Costa Rica.
2Escuela de Ingeniería Forestal, Tecnológico de Costa Rica. Costa Rica.
3Laboratorio PRIAS, Centro Nacional de Alta Tecnología. Costa Rica.
*Correspondence author: jcvalverde@itcr.ac.cr
Received: May 12th, 2020.
Approved: Jun 10th, 2020.
ABSTRACT
Hyperspectral and colorimetric patterns were determined from anatomical and physical aspects for the characterization of dry Peltogyne purpurea Pittier wood from natural forest trees. A sample of 24 P. purpurea wood discs was taken and anatomical characteristics (density and diameter of vessels, percentage of solitary vessels), wood density, colour (CIELab) and hyperspectral reflectance in the range of 310 to 1 100 nm in the dry wood, both in sapwood and heartwood section, were determined. Significant anatomical differences were found between sapwood and heartwood; a higher presence of solitary vessels was found in sapwood (34.28 %) but with a vessel density of 27.07 pores mm-2 and diameter of 148.53 ìm In the colorimetry analysis, brightness and b* (yellowing) were higher in sapwood, but with significantly lower values in a* (redness), thus generating a total color difference (higher than 14.55). As regards reflectance, three significant differentiation points were found between both sections, which were at 460, 580 and 1 020 nm; when correlating these three segments, no correlation was found with the anatomical aspects, but with the density of the wood (higher than 0.69), at the color level no relationship was found with the color parameter L* (brightness), while a* only showed inverse correlations at 580 nm and linear ones with b* at 580 nm. In this study no colorimetric relationships with anatomical aspects were found.
Keywords: tropical wood; spectroradiometry; wood anatomy; CIELab.
RESUMEN
Se determinaron lo patrones hiperespectrales y colorimétricos a partir de aspectos anatómicos y físicos para la caracterización de la madera seca de Peltogyne purpurea Pittier, procedente de árboles de bosque natural. Se tomó una muestra de 24 discos de madera de P. purpurea y se caracterizaron anatómicamente (densidad y diámetro de vasos, porcentaje de vasos solitarios), densidad madera, color (CIELab) y reflectancia hiperespectral en el rango de 310 a 1 100 nm en la madera seca, tanto en la sección de la albura como del duramen. Se encontraron diferencias significativas a nivel anatómico entre albura y duramen; encontrando una presencia mayor de vasos solitarios en albura (34,28 %) pero con una densidad de vasos de 27,07 poros mm-2 y diámetro de 148,53 ìm. En el análisis de la colorimetría, la luminosidad y b* (amarillamiento) fue mayor en albura, pero con valores significativamente menores en a* (enrojecido), generando con ello que la diferencia del color sea total (superior a 14,55). En cuanto la reflectancia se encontraron tres puntos de diferenciación significativa entre ambas secciones, que fueron a los 460, 580 y 1 020 nm; al correlacionar estos tres segmentos no se encontró correlación alguna con los aspectos anatómicos, pero sí con la densidad de la madera (superiores a 0,69), a nivel de color no se encontraron relaciones con el parámetro de color L* (luminosidad), mientras que a* solo mostró correlaciones inversas a los 580 nm y lineales con b* a 580 nm. En este estudio no se encontraron relaciones colorimétricas con aspectos anatómicos.
Palabras clave: Madera tropical; Espectroradiometría; Anatomía de la madera; CIELab.
RESUMO
Os padrões hiper-espectrais e colorimétricos foram determinados a partir de aspectos anatómicos e físicos para a caracterização da Púrpura Peltogyne seca Madeira Pittier a partir de árvores florestais naturais. Foi colhida uma amostra de discos de madeira de 24 P. purpúrea e foram determinadas características anatómicas (densidade e diâmetro dos vasos, percentagem de vasos solitários), densidade da madeira, cor (CIELab) e refletância hiper-espectral na gama de 310 a 1 100 nm na madeira seca, tanto na secção de borne como de cerne. Foram encontradas diferenças anatómicas significativas entre o borne e o cerne; foi encontrada uma maior presença de vasos solitários no borne (34,28%), mas com uma densidade de vasos de 27,07 poros/mm2 e um diâmetro de 148,53 ìm. Na análise colorimétrica, o brilho e b* (aparelhamento) foram maiores no borne, mas com valores significativamente menores em a* (avermelhamento), gerando assim uma diferença de cor total (superior a 14,55). No que respeita à reflectância, foram encontrados três pontos de diferenciação significativos entre as duas secções, que se situavam a 460, 580 e 1 020 nm; ao correlacionar estes três segmentos, não foi encontrada qualquer correlação com os aspectos anatómicos, mas com a densidade da madeira (superior a 0,69), ao nível da cor não foi encontrada qualquer relação com o parâmetro de cor L* (brilho), enquanto a* apenas apresentou correlações inversas a 580 nm e lineares com b* a 580 nm. Neste estudo não foram encontradas relações colorimétricas com aspectos anatómicos.
Palavras-chave: Madeira tropical; Espectroradiometria; Anatomia da madeira; CIELab.
INTRODUCTION
Wood is an organic material resulting from physiological processes of tree growth, which enables the fixation of carbon in organic compounds such as cellulose, hemicellulose, lignin, among others (Nabeela et al., 2015; Hall et al., 2017); it is a material that has been implemented throughout human history for the development of housing structures, tools and energy source (Kiat et al., 2019; Prãger et al., 2019). Currently, the global demand for wood continues to grow due to its adaptability to environmental conditions (Cesprini et al., 2020), low energy requirement for the transformation of the material (Yang et al., 2019), aesthetic appeal that varies according to the species (Nabeela et al., 2015), and biosustainability that simplifies waste management compared to other raw materials (Hall et al., 2017; Careviäc et al., 2019; Kiat et al., 2019).
The tropical region presents a wide variety of timber species, which implies that the supply of wood is wide (Simo-Tagne et al., 2016). Costa Rica has more than 2,000 identified tree species (Powers et al., 2009), but with wood characterizations limited to a small number of species in terms of knowledge of physical, mechanical and anatomical properties (Raãssa et al., 2014).
The diversity of timber species in tropical regions means that the sales market is wide (Holm et al., 2018), which means that in many cases a poorly identified species is marketed, resulting in erroneous sales of species, species with similar visual characteristics are mixed up, or sales prices are over- or underestimated (Schmidt et al., 2019). There is a need to have species identification systems that allow the fair commercialization of wood (Knauf, 2016); traditionally, physical characteristics are used for identification (Machado et al., 2019), aspects such as color, smell, taste, texture, type of knot, burst or hardness are implemented to differentiate the wood (Kobayashi et al., 2019). However, there are species that due to their high similarity or origin show very similar aspects, being necessary the macro or microscopic analysis for the differentiation, from anatomical elements as the type of vessel, density of vessels, type and characteristics of the parenchyma, characteristics of the fibers; this traditional procedure is a slow system, that requires specialists and that in some cases requires the consultation of specialized wood libraries (Fernández et al., 2019).
In view of this situation, in the last decade the development of alternative non-destructive methodologies has been initiated, which are of rapid evaluation and high level of precision (Ruffinatto et al., 2014; Whitau et al. 2016). Various methodologies and technologies have been implemented, such as odour sensors (Schreineret et al., 2018), identification systems based on DeepLearning in portable applications (Affonso et al., 2017; Cao et al., 2019) and identification of hyperspectral patterns (Bonifazi et al., 2015). The latter technique, hyperspectroscopy, consists of the collection and processing of information across the entire electromagnetic spectrum (Li et al., 2019). Its implementation has been extended to several scientific topics (Hänel et al., 2019), for example, in the use of remote sensors for coverage identification (Yuan et al., 2019), food quality (Baiano, 2017), microbiology (Herrero-Langreo, 2020) and pharmacological sciences (Wilczyñski et al., 2016). In addition to the identification of varieties and nutrition grades in agricultural species for productive purposes (Yang et al., 2010).
In the area of natural sciences, hyperspectometry, specifically reflectance, has been implemented in recent years in several areas, including: nutritional grade indicator (Chi et al., 2016), differentiator of effects of adverse soil conditions (Tan et al., 2020), differentiator of plants with the presence of pathogens (Ulrici et al., 2013), differentiator of species (Liu et al., 2019). In all these areas work has been done at the leaf level, due to the simplicity and understanding in the estimation of these variables from the reflectance, absorbance, transmittance and fluorescence of the leaf, aspects that directly affect the photosynthetic capacity of a plant (Chi et al., 2016) and that have allowed to relate them with variables such as leaf colour, leaf moisture content, density of nervures and growth rate (Li et al., 2019). It has been found that tropical species tend to form specific reflectance points within the spectrum, which are unique and allow the use of hyperspectral signatures; in the last decades the creation of signature collections for shrub and tree species has been initiated, finding that this characteristic can be unique in each species at foliar level (Chi et al., 2016; Machado et al., 2019).
However, with wood samples, the studies that have been developed with hyperspectroscopy have been limited. Studies developed by Tan et al., (2020) have shown relationships between reflectance between 300 and 450 nm with wood density in five temperate tree species, finding significant differentiation between species, but with behavioural homogeneity within each species. Kobayashi et al., (2019) found for ten species of the genus Eucalyptus spp. that there are no color differences between them, but the respective hyperspectral signatures between 550 and 710 nm, finding unique reflectance points for each species. On the other hand, Colares et al., (2016) with the species Swetenia macrophylla, determined that differentiations in lignin, cellulose and hemicellulose can be given at a macroscopic level from data of the visible spectrum and the near infrared, allowing to know in a non-destructive way the chemical properties of the wood Mvondo (2017). Finally, Schmidt et al., (2019) determined for five species of the genus Pinus spp. correlations between hyperspectral reflectance between 800 and 1 000 nm with the density and anatomical aspects of the wood, indicating that it is a non-destructive variable to project physical characteristics of the material. Considering this scientific basis, the present study aimed to identify hyperspectral and colorimetric patterns as a function of anatomical and physical aspects for the characterization of dry wood of Peltogyne purpurea Pittier from sustainable forest management plans in southern Costa Rica.
MATERIALS AND METHODS
Species and study site
Twenty-four stem segments (cross sections, the number of samples selected was based on a statistical power of 95 %) were collected and prepared from six Peltogyne purpurea Pittier trees (four samples per tree spaced approximately 4.5 m).
The wood segments came from trees with a diameter of 45 to 65 cm and each sample was 50 mm thick, with a moisture content of less than 20 % and a clear visual presence of sapwood and heartwood. The material was obtained from a sustainable forest management plan of natural forest in a private farm located in the Osa Peninsula, Puntarenas, Costa Rica (8°53'38'' N and 83°30'51'' W). The site was characterized by an altitude of 350 m, with an average annual temperature of 32 °C and annual rainfall of 4 500 mm; the topography of the land was moderately undulating, with slopes up to 35° and clayey soils. The density of trees over 10 cm in diameter in the forest was 245 trees. The selected trees were those exceeding diameter at 1.3 m above 45 cm and being in the same age range, phytosanitary condition and environmental conditions.
Measurement procedure
In each shaft segment, its moisture content was measured in order to make it uniform and avoid being a source of variation (the final moisture content was worked out at 12 to 15 %). Each sample was selected to have the most uniform face, with the least amount of natural defects (knots, cracks, curvatures, insect bites, etc.) and minimum deterioration from the harvesting process (cut marks, bruises, etc.). On the selected face, three radii were determined from the central axis of the sample (Figure 1). Each radius was distanced at 120° and measured from the beginning of the bark to the center of the piece. The length of the sapwood (which for this species is light yellow), heartwood (dark purple) and pith (generally dark purple) was measured at each transverse session.).
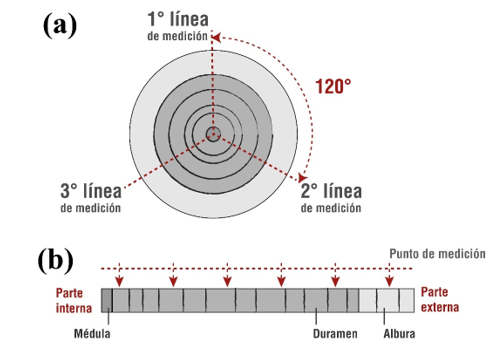
Figure 1. - Detail of the process of location of sampling points of stem segments of Peltogyne purpurea
Six control points were placed on each measurement line, at which all the tests in the study were performed. An area of 1 cm2 was cleaned at each measurement point, where any defects in the wood were removed with a scalpel. The measurement points were spaced proportionally and the sapwood-hardness transition point was avoided. Both the first and the last measuring point were spaced 30 mm from the edge and the pith of the sample respectively.
Hyperspectral evaluation
The hyperspectral evaluation, specifically of reflectance, was developed with a portable PP System radiometer spectrum, type UniSpec SC. A range of 310 to 1100 nm (visible and near-infrared spectrum) was used, with a measurement interval of 10 nm and a programmed measurement time of 4 ms. The implemented sensor had a standard certification "SMA 905 connectors", according to this type of instrumentation, with an effective area of 3 mm2. The sensor was placed perpendicular to the surface by means of a closed compartment in order to avoid biases in the measurement due to the effect of external light. All the measurements were carried out in a site with a homogeneous luminosity of 600 lux.
Colorimetric evaluation
The colour was evaluated with a standardised CIE chromatography NIX Pro spectrophotometer. It analyzes the colorimetry between the ranges of 400 to 700 nm with a measuring point of 10 mm in diameter. For the observation of the reflection of the specular component (SCI mode) it was adjusted to an angle of 10, which is normal for the surface of organic materials (D65/10) and with a D65 (corresponding to daylight at 6 500 K). The color was evaluated in CIELAB format, which generated three parameters to explain the color, which consisted of L* (brightness, with a scale from 0 to 100, where 0 is black and 100 is white), a * (color trend from red to green, with an infinite scale, as the value tends more positive to red and more negative to green) and b * (color trend from yellow to blue, with an infinite scale, as the value tends positive to yellow and negative to blue).
From the values obtained, both sapwood and heartwood were compared to each other by means of the colour differential (ΔE*) which was defined as the net variation in colour between two scenarios, as established by ASTM D 2244 (2013) whose formula is detailed in equation 1. The ΔE* was implemented to find colour differences between photographs and physical samples and thus identify the degree of colour representativeness, using Cuiet al categories. (2004), which establishes five levels of colour change perceived by the human eye: if 0 <ΔE*> 1.5, the change in colour is not perceived by the human eye; if 1.5 <ΔE*> 3.0, the change in colour is hardly perceived; if 3.0 <ΔE**> 6.0, the change is perceived; if 6.0 <ΔE*> 12.0, the change in colour is quite noticeable by the human eye and finally if ΔE** is greater than 12, there is a total change in colour (Equation 1).
Where:
ΔE** color differential; ÄL* is L* of the analyzed photo protocol - L* physical sample;
Δa* is a* of the analyzed photo protocol - a* physical sample;
Δb* is b* of the analyzed photo protocol - b* physical sample.
Anatomical characterization and density
Anatomically, the density and diameter of vessels present at each measuring point was determined with an analysis area of 1 cm2. The image for the analysis was obtained using a Celestron electronic connection microscope, in colour mode and with a resolution of 5 MP and the photographs were taken at a magnification of 40 X; they were then processed with the Image J program, according to the procedure of Valverde et al., (2018).
With respect to the density of the wood, cubic samples with a face of 1 cm were taken from several cross sections, to which the Archimedes method was applied to determine the density, dividing the mass by the volume (water was used as a fluid assuming a density of 1 g cm-3 ). For their estimation, the samples were previously dried to a homogeneous moisture content of 12 %
Statistical analysis
Firstly, a descriptive analysis of anatomical, colorimetric and density characteristics was carried out; to determine whether significant differences in properties between sapwood and heartwood occurred, an analysis of one way variance (ANDEVA) was performed (previously the analysis of assumptions of normality of residues and homocedasticity of variances was carried out). In case of significant differences in results, the Tukey test was applied for comparison of means.
In the case of reflectance, the average reflectance curve was generated and an ANDEVA was developed to compare the different points in order to find significant differentiation values. Later, the second derivative was applied to the curve according to the methodology of Romero-Ramirez et al., (2015), in order to eliminate the noise from chemical and physical aspects not considered in the study and that could generate error in the measurement; then, to the identified points of the length an ANDEVA analysis was applied again to validate the reflectance. The points were differentiated in both analyses and a principal component analysis (PCA) was applied to quantify the degree of variation between sapwood and heartwood.
Finally, significant reflectance points were correlated with physical and anatomical variables using a Pearson correlation analysis. The statistical analyses were performed with the STATISTICA version 3.1 (Statsoft, 2015) programs, with a significance level of 0.05.
RESULTS
Physical and anatomical characterization of the species
It was determined that P. purpurea wood presents significant variations in density and anatomical characteristics differentiated between sapwood and heartwood; finding that the average density in sapwood is 0.62 g cm-3, being significantly lower than the one obtained in heartwood of 0.78 g cm-3 (which did not show significant variations along the heartwood). Similarly, significant variations were found at the anatomical level, with a greater presence of solitary vessels in the sapwood (34.28 %), with respect to the heartwood (27.32 %), and with a density of 27.07 pores mm-2 and average diameter of 148.53 ìm (Table 1).
Table 1. - Density and anatomical characterisation of sapwood and heartwood of dry P. purpurea wood from natural forest
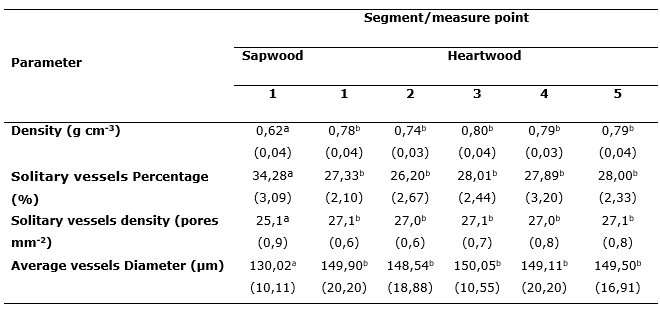
Note: different letters show significant differences (P<0.05); values in brackets correspond to standard deviation
Colorimetric variation
At a colorimetric level (Table 2), significant variations were found between sapwood and heartwood in the parameter L* (brightness) and b* (yellow-blue tendency), finding that the brightness of sapwood (56.80) is significantly higher than heartwood (average 42.07). A similar case was found with a*, where heartwood showed a high reddish colouring (29.40), compared to heartwood which showed a neutral tendency (1.20). On the other hand, with parameter b* considerable differences were found, the sapwood showed a yellowish tendency (32.81), compared to heartwood which on average showed a value of 1.08 considered as neutral.
With respect to ΔE*, the difference between the heartwood measurements was 0.09, considered to be a change not perceived by the human eye, while the differentiation between sapwood and heartwood was greater than 14.55 and classified as a total change in colour; in this case totally perceptible by the human eye, being a variable of simple visual differentiation.
Table 2. - Colorimetric and differential characterization of the sapwood and heartwood of dry P. purpurea wood from natural forest
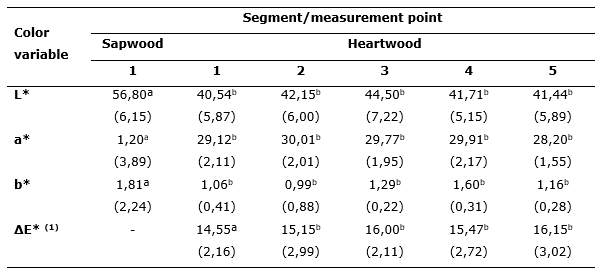
Note: different letters show significant differences
(P < 0.05); values in brackets correspond to
standard deviation.
(1) Data from ΔE* were estimated between the sapwood for each heartwood value
of the samples
Wood's reflective behavior
With the reflectance (Figure 2a) it was determined that between the values of 310 and 450 nm no differences were obtained in the reflectance of sapwood and heartwood, found between 310 and 400 nm a reflectance variation of 0.80 to 0.92. After 400 nm, the reflectance showed uniform patterns, with a decrease to 450 nm of 0.212. After 400 nm, the reflectance showed uniform patterns, with a decrease up to 450 nm of 0.212. It is from 460 nm onwards that both segments of wood showed differences, being significantly higher in sapwood than in heartwood; behaviour that remained constant up to 580 nm, where a higher reflectance was determined in sapwood (0.234) with respect to heartwood (0,178). Reflectance then increased to 900 nm, with the process showing a greater increase in heartwood than sapwood, but no statistically significant difference. It is after 900 nm that the reflectance begins to stabilise at values close to 0.844; but with a statistical differentiation at 1 020 nm, where the heartwood was greater than the sapwood.
To eliminate the effects of interference in the reflectance generated by chemical and physical compounds that could be present in the wood given by the effects of drying, the second derivative was determined from the data curve (Figure 2b), thus finding the following characteristics: the variation of the reflectance of the second derivative is ± 0.0025, which implies that it is a homogeneous variation; it is evident that in the visible spectrum at 460, 580 nm and in the near infrared at 1 080 nm there are significant differences between sapwood and heartwood, confirming the patterns given in the reflectance; between 590 and 1 000 nm there are common oscillations between sapwood and heartwood that do not show significance, being a similar behaviour between both sections; from 310 to 400 nm and from 1 050 to 1 100 nm the variations obtained are not representative due to the great variation of reflectance of those segments that the second derivative is not representative.
When determining the degree of variation with significance of the spectral reflectance (Figure 2 a) it was statistically confirmed that at 460, 580 and 1 020 nm the differences are significant, with differentiation values of 65 to 82 %, considered as high and permissible to be considered as differentiation criteria between both segments, being in the visible spectrum the 460 nm as the point of highest variation, while in the near infrared the differentiation at 1 020 nm is 88 % between both sections. With respect to the analysis of main components (Figure 3), clusters of sapwood and heartwood data were found for the three lengths of reflectance analysed, which tended to show differentiated clusters.
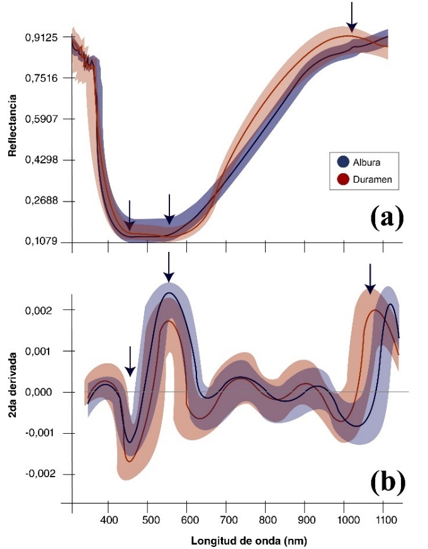
Figure 2. - Reflectance (a) and second derivative of reflectance (b) of sapwood and
heartwood sections in dry P. purpurea wood from natural forest
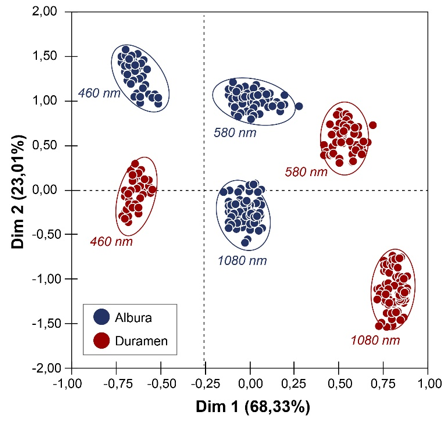
Figure 3. - PCA of the three wavelength points; reflectance of sapwood and heartwood
sections showed
significant differences in dried P. purpurea wood from natural forest
Relationship of reflectance and physical and anatomical variables
Pearson's correlation analyses relating physical and anatomical characteristics to the three wavelength points at which reflectance showed variation (Table 3), allow the same behaviour to be observed with sapwood and heartwood in the first instance. They showed no significant correlation with vessel density, vessel diameter and percentage of solitary vessels, finding correlation coefficients lower than 0.22. On the other hand, significant correlations were found with wood density, which varied from 0.55 to 0.60, with the length of the near infrared of 1 020 nm being the one that showed the highest correlation. Regarding the correlation between the three wavelengths, they were not significant and varied between 0.15 and 0.42. On the other hand, at an anatomical level, correlations higher than 0.85 were found between the percentage of single vessels and their diameter, as well as between wood density and vessel density. Finally, no correlation was found between density and percentage of single vessels.
Table 3. - Pearson's correlation analysis of the three main wavelength points, where reflectance
showed significance with physical
and anatomical data of sapwood and heartwood sections in
P. purpurea
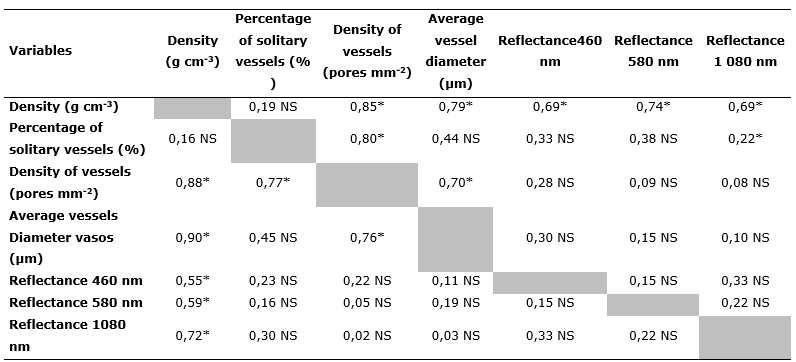
Note NS: not significant differences at (P < 0.05); upper part of diagonal corresponds to correlations of sapwood, lower part to heartwood
In the correlation between the three relevant lengths of spectral reflectance with the colour in CIELab format (Table 4), the same correlation behaviour was again evident as that shown for sapwood and heartwood; firstly, among the three colour variables, correlation coefficients greater than 0.70 were obtained. On the other hand, with brightness (L*) no significant correlation was obtained with values below 0.25; with the a* value only an inversely significant correlation was shown with the length of 460nm (from -0.62 in sapwood and -0.60 in heartwood). No correlation was found for the lengths of 580nm and 1020nm. Finally, with parameter b*, the only significant correlation was recorded with the length of 580 nm and was greater than 0.75.
Table 4. - Pearson correlation analysis of main reflectance points and Lab color data in sapwood and heartwood sections in P. purpurea
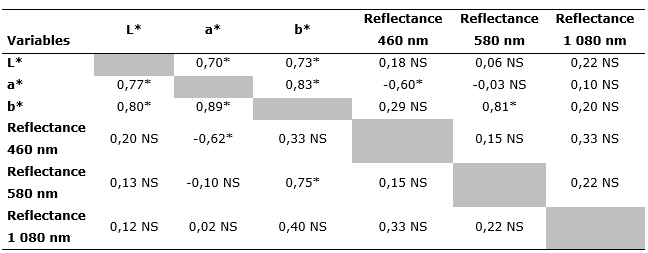
Note: NS: not significant differences at (P < 0.05); upper part of diagonal corresponds to correlations of sapwood, lower part to heartwood
DISCUSSION
Variations between sapwood and heartwood
The differentiations in anatomical and physical properties identified between the sapwood and heartwood of P. purpurea are explained by a greater density of vessels and a larger diameter in the sapwood, a region which is characterised as the active part of the xylem (Cao et al., 2019). Studies carried out by Colares et al., (2016) found for twelve tropical species that the xylem tissue of the sapwood is active and mobilises between 10 and 20 % more water and nutrients within the tree; in contrast, the heartwood is a region of dead cells that produces an accumulation of extractive agents by physiological sub-processes, oxidation of extractives that affect the colouring of the wood (greater darkness of colour). Colares et al. (2016) mention that decreases in the diameter of vessels in the heartwood are due to the accumulation of organic and inorganic substances in the walls of the vessels, accumulation of tannins, oils, gums, resins, dyes, aromatic compounds, calcium carbonate, silica, among others; they thicken the wall, affecting that its diameter is smaller and that in some cases the vessels are filled, causing that at the moment of quantification of the density of vessels they are diminished. On the other hand, Machado et al., (2019) consider in broadleaf species that present solitary vessels tend to close near about 15 % of their vessels in the xylem by the accumulation of tannins and waxes that affect that their density decreases.
It is important to note that the inference of accumulation of organic and inorganic substances in the walls and decrease in density affects the increase in density of the wood and changes in the color of the wood; Fernández et al., (2019) determined for three broadleaf species that the increase in density of the heartwood is due to the accumulation and mobilization of nutrients in the broadleaf, which tends to store nutrients and especially organic solutions in the heartwood to be used when the species is subjected to water stress, because by presenting more closed vessels, the loss of nutrients and water by negative pressure from the soil is lower, which allows a greater probability of survival of the species. Meanwhile, the colorimetric differentiation between sapwood and heartwood, according to Yang et al., (2019), is due to the accumulation of tannins and waxes in the inactive parts of the xylem, which can be 50 to 70 % greater than the active part of the xylem, due to the cellular activity, hydraulic mobility of the species, which at the moment of being cut and diminishing its humidity content, begins a process of oxidation and reduction in the heartwood that influences that it obtains a darker coloration than the sapwood. Chi et al. (2016) mention that the lower the concentration of starches and the higher the concentration of phenols and tannins, the darker and more reddish the colour.
Implications of physical and anatomical properties with hyperspectral reflectance
The results did not present a direct correlation with anatomical aspects, this was due to Chi et al., (2016), because the aspects that have more inference in the reflectance in woods are due to the chemical composition. Lignin, cellulose and hemicellulose directly affect the reflectance, and the presence of extractive increases the absorption of light. Corals et al., (2016), with Swetenia macrophylla, found that although the anatomical discrepancies between sapwood and heartwood are significant, the differentiation of reflectance was due to the concentration of lignin, extractives and hemicellulose, which were higher in heartwood than in sapwood, which allowed them to find differences at 490, 700 and 1 050 nm; In the case of wood density, the same authors mention that the correlations that can occur with reflectance are due to the concentration of extractives compounds that affect a change in reflectance in the visible and infrared spectrum, which is why they recommend correlating them more with the chemical part of the species in order to identify the spectral patterns of species.
According to the results of the present study, the relationship of the anatomy of the wood of this species was discarded, when analyzing the colorimetric aspect and finding only relations with the length of 580 nm, which is where the reflectance of the colors considered yellow occurs, aspect that is denoted with the linear correlation with the variable b* and vice versa with a*. According to Hall et al., (2017), in the CIELab system, the b* coordinate is the one that infers the yellow-blue coloration, which produces high values in the length of 580 nm that infer that the yellow coloration increases, while the coloration in 460 nm tends to greenish lengths, hence the inverse relationship with the a* color coordinate. On the other hand, the little relation with the luminosity according to Holm et al., (2018) is due to the fact that it is a variable that has a greater relation with the absorption of the light by the surface, in the case of woods it is close to 55-65 % of the light that falls, while the reflectance is less than 30 %; hence the luminosity does not tend to present significance with the length of reflectance obtained.
Potential of hyperspectral reflectance as a species differentiator
Although it is known that reflectance is functional for the identification and differentiation of species at the leaf level, as mentioned by Kiat et al., (2018), at the wood level, studies have been limited, but the potential for application is wide. Liu et al., (2019) mention that light reflectance and absorption in wood would not only allow the identification of species, but would also make it possible to estimate in a non-destructive way the cellulose, hemicellulose and lignin concentrations, and at the same time the colouring potential of the wood when it is dry. On the other hand, Schmidt et al., (2019) highlight the potential of spectrometry as an indicator of wood quality for the development of pellets as a solid fuel; the system would facilitate the evaluation of the chemical composition of the pellets and estimation by means of caloric potential models of the species.
Powers et al., (2009) emphasize that reflectance should be seen as more than an indicator of species or chemical composition, it should be understood as a methodology for evaluating wood quality, identifying points of material failure (spectral evidence of microfalls) and wood drying systems. This type of research should be encouraged and focused on understanding the presence of elements such as calcium, nitrogen, potassium, phosphorus, among others; elements that, according to scientists, are relevant in the silvicultural management of plantations and that at the time of wood extraction there is a nutritional loss, which should be analyzed for the development of fertilization packages.
Significant anatomical differences were found between the sapwood and heartwood sections of the wood.
The sapwood presented a higher number of solitary vessels (38.4 %), a higher vessel density with 27.07 pores mm-2 and an average vessel diameter of 148.53 ìm.
The heartwood showed a significantly higher wood density (0.78 g cm-3).
In colorimetry, brightness and b* were higher in sapwood, but with significantly lower values in a*, obtaining a color differential greater than 14.55 (total color change). With the reflectance, three significant differentiation points were found which were at 460, 580 and 1 020 nm; when correlating these three segments, no correlation was found with the anatomical aspects, but with the density of the wood (higher than 0.69), at the colour level no relationship was found with the colour parameter L*, while a* only showed inverse and linear type correlations with b* at 580 nm. Finally, no colorimetric relationships with anatomical aspects were found.
REFERENCES
AFFONSO, C., ROSSI, A.L.D., VIEIRA, F.H.A. y DE CARVALHO, A.C.P. de L.F., (2017). Deep learning for biological image classification. Expert Systems with Applications [en línea], vol. 85, pp. 114-122. [Consulta: 13 mayo 2020]. ISSN 0957-4174. DOI 10.1016/j.eswa.2017.05.039. Disponible en: http://www.sciencedirect.com/science/article/pii/S0957417417303627.
BAIANO, A., (2017). Applications of hyperspectral imaging for quality assessment of liquid based and semi-liquid food products: A review. Journal of Food Engineering [en línea], vol. 214, pp. 10-15. [Consulta: 13 mayo 2020]. ISSN 0260-8774. DOI 10.1016/j.jfoodeng.2017.06.012. Disponible en: http://www.sciencedirect.com/science/article/pii/S0260877417302546.
BONIFAZI, G., CALIENNO, L., CAPOBIANCO, G., LO MONACO, A., PELOSI, C., PICCHIO, R. y SERRANTI, S., (2015). Modeling color and chemical changes on normal and red heart beech wood by reflectance spectrophotometry, Fourier Transform Infrared spectroscopy and hyperspectral imaging. Polymer Degradation and Stability [en línea], vol. 113, pp. 10-21. [Consulta: 13 mayo 2020]. ISSN 0141-3910. DOI 10.1016/j.polymdegradstab.2015.01.001. Disponible en: http://www.sciencedirect.com/science/article/pii/S0141391015000129.
CAO, X., GE, Y., LI, R., ZHAO, J. y JIAO, L., (2019). Hyperspectral imagery classification with deep metric learning. Neurocomputing [en línea], vol. 356, pp. 217-227. [Consulta: 13 mayo 2020]. ISSN 0925-2312. DOI 10.1016/j.neucom.2019.05.019. Disponible en: http://www.sciencedirect.com/science/article/pii/S0925231219306800.
CAREVIÆ, I., SERDAR, M., ŠTIRMER, N. y UKRAINCZYK, N., (2019). Preliminary screening of wood biomass ashes for partial resources replacements in cementitious materials. Journal of Cleaner Production [en línea], vol. 229, pp. 1045-1064. [Consulta: 13 mayo 2020]. ISSN 0959-6526. DOI 10.1016/j.jclepro.2019.04.321. Disponible en: http://www.sciencedirect.com/science/article/pii/S0959652619314180.
CESPRINI, E., RESENTE, G., CAUSIN, V., URSO, T., CAVALLI, R. y ZANETTI, M., (2020). Energy recovery of glued wood waste A review. Fuel [en línea], vol. 262, pp. 116520. [Consulta: 13 mayo 2020]. ISSN 0016-2361. DOI 10.1016/j.fuel.2019.116520. Disponible en: http://www.sciencedirect.com/science/article/pii/S0016236119318745.
CHI, G., MA, J., SHI, Y. y CHEN, X., (2016). Hyperspectral remote sensing of cyanobacterial pigments as indicators of the iron nutritional status of cyanobacteria-dominant algal blooms in eutrophic lakes. Ecological Indicators [en línea], vol. 71, pp. 609-617. [Consulta: 13 mayo 2020]. ISSN 1470-160X. DOI 10.1016/j.ecolind.2016.06.014. Disponible en: http://www.sciencedirect.com/science/article/pii/S1470160X16303144.
COLARES, C.J.G., PASTORE, T.C.M., CORADIN, V.T.R., MARQUES, L.F., MOREIRA, A.C.O., ALEXANDRINO, G.L., POPPI, R.J. y BRAGA, J.W.B., (2016). Near infrared hyperspectral imaging and MCR-ALS applied for mapping chemical composition of the wood specie Swietenia Macrophylla King (Mahogany) at microscopic level. Microchemical Journal [en línea], vol. 124, pp. 356-363. [Consulta: 13 mayo 2020]. ISSN 0026-265X. DOI 10.1016/j.microc.2015.09.022. Disponible en: http://www.sciencedirect.com/science/article/pii/S0026265X15002234.
DE SOUSA FERNANDES, D.D., DE ALMEIDA, V.E., FONTES, M.M., DE ARAÚJO, M.C.U., VÉRAS, G. y DINIZ, P.H.G.D., (2019). Simultaneous identification of the wood types in aged cachaças and their adulterations with wood extracts using digital images and SPA-LDA. Food Chemistry [en línea], vol. 273, pp. 77-84. [Consulta: 13 mayo 2020]. ISSN 0308-8146. DOI 10.1016/j.foodchem.2018.02.035. Disponible en: http://www.sciencedirect.com/science/article/pii/S0308814618302620.
FENG, Y., JIANLONG, L., XIAOYU, G., YURONG, Q., XIAOLING, W. y QI, Y., (2010). Assessing nutritional status of Festuca arundinacea by monitoring photosynthetic pigments from hyperspectral data. Computers and Electronics in Agriculture [en línea], vol. 70, no. 1, pp. 52-59. [Consulta: 13 mayo 2020]. ISSN 0168-1699. DOI 10.1016/j.compag.2009.08.010. Disponible en: https://europepmc.org/article/agr/ind44306392.
HALL, E.M., BRADY, S.P., MATTHEUS, N.M., EARLEY, R.L., DIAMOND, M. y CRESPI, E.J., (2017). Physiological consequences of exposure to salinized roadside ponds on wood frog larvae and adults. Biological Conservation [en línea], vol. 209, pp. 98-106. [Consulta: 13 mayo 2020]. ISSN 0006-3207. DOI 10.1016/j.biocon.2017.02.013. Disponible en: http://www.sciencedirect.com/science/article/pii/S0006320716304517.
HERRERO-LANGREO, A., SCANNELL, A.G.M. y GOWEN, A., (2020). Chapter 3.5 - Hyperspectral imaging for food-related microbiology applications. En: J.M. AMIGO (ed.), Data Handling in Science and Technology [en línea]. S.l.: Elsevier, Hyperspectral Imaging, pp. 493-522. [Consulta: 13 mayo 2020]. Disponible en: http://www.sciencedirect.com/science/article/pii/B9780444639776000201
HOLM, S., THEES, O., LEMM, R., OLSCHEWSKI, R. y HILTY, L.M., (2018). An agent-based model of wood markets: Scenario analysis. Forest Policy and Economics [en línea], vol. 95, pp. 26-36. [Consulta: 13 mayo 2020]. ISSN 1389-9341. DOI 10.1016/j.forpol.2018.07.005. Disponible en: http://www.sciencedirect.com/science/article/pii/S138993411830234X.
KIAT, P.E., MALEK, M.A. y SHAMSUDDIN, S.M., (2020). Net carbon stocks change in biomass from wood removal of tropical forests in Sarawak, Malaysia. Journal of King Saud University - Science [en línea], vol. 32, no. 1, pp. 1096-1099. [Consulta: 13 mayo 2020]. ISSN 1018-3647. DOI 10.1016/j.jksus.2019.09.012. Disponible en: http://www.sciencedirect.com/science/article/pii/S1018364719317835.
KNAUF, M., (2016). The wood market balance as a tool for calculating wood use's climate change mitigation effect An example for Germany. Forest Policy and Economics [en línea], vol. 66, pp. 18-21. [Consulta: 13 mayo 2020]. ISSN 1389-9341. DOI 10.1016/j.forpol.2016.02.004. Disponible en: http://www.sciencedirect.com/science/article/pii/S1389934116300156.
KOBAYASHI, K., HWANG, S.-W., OKOCHI, T., LEE, W.-H. y SUGIYAMA, J., (2019). Non-destructive method for wood identification using conventional X-ray computed tomography data. Journal of Cultural Heritage [en línea], vol. 38, pp. 88-93. [Consulta: 13 mayo 2020]. ISSN 1296-2074. DOI 10.1016/j.culher.2019.02.001. Disponible en: http://www.sciencedirect.com/science/article/pii/S1296207418306927.
LI, F., LU, H. y ZHANG, P., (2019). An innovative multi-kernel learning algorithm for hyperspectral classification. Computers & Electrical Engineering [en línea], vol. 79, pp. 106456. [Consulta: 13 mayo 2020]. ISSN 0045-7906. DOI 10.1016/j.compeleceng.2019.106456. Disponible en: http://www.sciencedirect.com/science/article/pii/S0045790619309693.
LIU, Y., ZHOU, S., HAN, W., LIU, W., QIU, Z. y LI, C., (2019). Convolutional neural network for hyperspectral data analysis and effective wavelengths selection. Analytica Chimica Acta [en línea], vol. 1086, pp. 46-54. [Consulta: 13 mayo 2020]. ISSN 0003-2670. DOI 10.1016/j.aca.2019.08.026. Disponible en: http://www.sciencedirect.com/science/article/pii/S0003267019309675.
MACHADO, J.S., PEREIRA, F. y QUILHÓ, T., (2019). Assessment of old timber members: Importance of wood species identification and direct tensile test information. Construction and Building Materials [en línea], vol. 207, pp. 651-660. [Consulta: 13 mayo 2020]. ISSN 0950-0618. DOI 10.1016/j.conbuildmat.2019.02.168. Disponible en: http://www.sciencedirect.com/science/article/pii/S0950061819304635.
MVONDO, R.R.N., MEUKAM, P., JEONG, J., MENESES, D.D.S. y NKENG, E.G., (2017). Influence of water content on the mechanical and chemical properties of tropical wood species. Results in Physics [en línea], vol. 7, pp. 2096-2103. [Consulta: 13 mayo 2020]. ISSN 2211-3797. DOI 10.1016/j.rinp.2017.06.025. Disponible en: http://www.sciencedirect.com/science/article/pii/S2211379717304862.
NABEELA, F., MURAD, W., KHAN, I., MIAN, I.A., REHMAN, H., ADNAN, M. y AZIZULLAH, A., (2015). Effect of wood ash application on the morphological, physiological and biochemical parameters of Brassica napus L. Plant Physiology and Biochemistry [en línea], vol. 95, pp. 15-25. [Consulta: 13 mayo 2020]. ISSN 0981-9428. DOI 10.1016/j.plaphy.2015.06.017. Disponible en: http://www.sciencedirect.com/science/article/pii/S0981942815300462.
POWERS, J.S., BECKNELL, J.M., IRVING, J. y PÈREZ-AVILES, D., (2009). Diversity and structure of regenerating tropical dry forests in Costa Rica: Geographic patterns and environmental drivers. Forest Ecology and Management [en línea], vol. 258, no. 6, pp. 959-970. [Consulta: 13 mayo 2020]. ISSN 0378-1127. DOI 10.1016/j.foreco.2008.10.036. Disponible en: http://www.sciencedirect.com/science/article/pii/S0378112708008165.
PRÄGER, F., PACZKOWSKI, S., SAILER, G., DERKYI, N.S.A. y PELZ, S., (2019). Biomass sources for a sustainable energy supply in Ghana A case study for Sunyani. Renewable and Sustainable Energy Reviews [en línea], vol. 107, pp. 413-424. [Consulta: 13 mayo 2020]. ISSN 1364-0321. DOI 10.1016/j.rser.2019.03.016. Disponible en: http://www.sciencedirect.com/science/article/pii/S1364032119301492.
RUFFINATTO, F., CREMONINI, C., MACCHIONI, N. y ZANUTTINI, R., (2014). Application of reflected light microscopy for non-invasive wood identification of marquetry furniture and small wood carvings. Journal of Cultural Heritage [en línea], vol. 15, no. 6, pp. 614-620. [Consulta: 13 mayo 2020]. ISSN 1296-2074. DOI 10.1016/j.culher.2013.11.013. Disponible en: http://www.sciencedirect.com/science/article/pii/S1296207413002227.
SCHMIDT, C., WESTERMANN, H.-H. y STEINHILPER, R., (2019). An investigation of buzz saw blade cutting forces depending on tool geometry for cutting frozen wood. Procedia Manufacturing [en línea], vol. 33, pp. 778-785. [Consulta: 13 mayo 2020]. ISSN 2351-9789. DOI 10.1016/j.promfg.2019.04.098. Disponible en: http://www.sciencedirect.com/science/article/pii/S2351978919305797.
SCHREINER, B., SONA, B. y LOOS, H., (2018). The smell of wood and its impact on physiological responses. International Journal of Psychophysiology [en línea], pp. 131:S40. [Consulta: 13 mayo 2020]. DOI. 10.1016/j.ijpsycho.2018.07.123. Disponible en: https://www.researchgate.net/publication/328060187_The_smell_of_wood_and_its_impact_on_physiological_responses.
SIMO-TAGNE, M., RÉMOND, R., ROGAUME, Y., ZOULALIAN, A. y BONOMA, B., (2016). Modeling of coupled heat and mass transfer during drying of tropical woods. International Journal of Thermal Sciences [en línea], vol. 109, pp. 299-308. [Consulta: 13 mayo 2020]. ISSN 1290-0729. DOI 10.1016/j.ijthermalsci.2016.06.012. Disponible en: http://www.sciencedirect.com/science/article/pii/S1290072916307232.
TAN, K., WANG, H., CHEN, L., DU, Q., DU, P. y PAN, C., (2020). Estimation of the spatial distribution of heavy metal in agricultural soils using airborne hyperspectral imaging and random forest. Journal of Hazardous Materials [en línea], vol. 382, pp. 120987. [Consulta: 13 mayo 2020]. ISSN 0304-3894. DOI 10.1016/j.jhazmat.2019.120987. Disponible en: http://www.sciencedirect.com/science/article/pii/S0304389419309410.
ULRICI, A., SERRANTI, S., FERRARI, C., CESARE, D., FOCA, G. y BONIFAZI, G., (2013). Efficient chemometric strategies for PETPLA discrimination in recycling plants using hyperspectral imaging. Chemometrics and Intelligent Laboratory Systems [en línea], vol. 122, pp. 31-39. [Consulta: 13 mayo 2020]. ISSN 0169-7439. DOI 10.1016/j.chemolab.2013.01.001. Disponible en: http://www.sciencedirect.com/science/article/pii/S0169743913000129.
WHITAU, R., DILKES-HALL, I.E., DOTTE-SAROUT, E., LANGLEY, M.C., BALME, J. y O'CONNOR, S., (2016). X-ray computed microtomography and the identification of wood taxa selected for archaeological artefact manufacture: Rare examples from Australian contexts. Journal of Archaeological Science: Reports [en línea], vol. 6, pp. 536-546. [Consulta: 13 mayo 2020]. ISSN 2352-409X. DOI 10.1016/j.jasrep.2016.03.021. Disponible en: http://www.sciencedirect.com/science/article/pii/S2352409X1630089X.
WILCZYÑSKI, S., KOPROWSKI, R., MARMION, M., DUDA, P. y B£OÑSKA-FAJFROWSKA, B., (2016). The use of hyperspectral imaging in the VNIR (4001000nm) and SWIR range (10002500nm) for detecting counterfeit drugs with identical API composition. Talanta [en línea], vol. 160, pp. 1-8. [Consulta: 13 mayo 2020]. ISSN 0039-9140. DOI 10.1016/j.talanta.2016.06.057. Disponible en: http://www.sciencedirect.com/science/article/pii/S0039914016304830.
YANG, H., CHAO, W., WANG, S., YU, Q., CAO, G., YANG, T., LIU, F., DI, X., LI, J., WANG, C. y LI, G., (2019). Self-luminous wood composite for both thermal and light energy storage. Energy Storage Materials [en línea], vol. 18, pp. 15-22. [Consulta: 13 mayo 2020]. ISSN 2405-8297. DOI 10.1016/j.ensm.2019.02.005. Disponible en: http://www.sciencedirect.com/science/article/pii/S2405829718313850.
Conflict of interests:
The authors declare not to have any interest conflicts.
Authors' contribution:
The authors have participated in the writing of the work and analysis of the documents.
![]()
This work is licensed under a Creative Commons Attribution-NonCommercial 4.0 International license
Copyright (c) 2020 Juan Carlos Valverde, Dagoberto Arias Aguilar, Kevin Arias, Marvin Castillo, Cornelia Miller, Heileen Aguilar, Daniel Flores