Revista Cubana de Ciencias Forestales. 2020, enero-abril 8(1):138-153![]()
Translated from the original in spanish
Assessment of the quality of poles for aerial networks in the impregnation process. EFI. Macurije
Valoración de la calidad de postes para redes aéreas en el proceso de impregnación. EFI. Macurije
Avaliação da qualidade dos postes para redes aéreas no processo de impregnação. EFI. Macurije
Oxandra Roca Rivera1* ![]() https://orcid.org/0000-0002-3544-9540
https://orcid.org/0000-0002-3544-9540
Saray Núñez
González1 ![]() https://orcid.org/0000-0001-6383-8837
https://orcid.org/0000-0001-6383-8837
Yosvani Orlando Lao León2
![]() https://orcid.org/0000-0001-7491-3548
https://orcid.org/0000-0001-7491-3548
1Universidad de Pinar del Río "Hermanos Saíz Montes de Oca", Pinar del Río, Cuba.
2Universidad de Holguín, Cuba.
*Corresponding author: oxandra.roca@upr.edu.cu
Received: December 20th, 2019.
Approved:
March 20th, 2020.
ABSTRACT
This article summarizes the main results of the statistical control carried out to the production of poles for aerial networks in the Unidad Empresarial de Base Planta de Impregnación located in the Agroforestry Enterprise Macurije, in the province of Pinar del Río. In carrying out the investigation, the problem identified by customers related to the low quality of the final product of the impregnation process of poles for aerial networks was taken into account. Consequently, the objective of this article is to identify the causes of the quality defects of the utility poles in the impregnation process at the UEB Planta de Impregnación. For the statistical control of quality defects, control graphics were used for attributes, specifically the graphics for the number of defects per unit and Poisson capacity analysis using Minitab 17.0 software, as well as the Current Reality Tree for the identification of root causes. Based on the diagnosis made, poles were identified that do not comply with the quality indicators established in the labor standards; in addition to a failure to meet the demand for these products, causing customer dissatisfaction. At the same time, the root cause of the defects was identified as deficiencies in the production process.
Keywords: statistical control; quality defects; control charts; impregnation process; productive process.
RESUMEN
En el presente artículo, se resumieron los principales resultados del control estadístico realizado a la producción de postes para redes aéreas en la Unidad Empresarial de Base Planta de Impregnación ubicada en la Empresa Agroforestal Macurije, en la provincia de Pinar del Río. Para la realización de la investigación se tuvo en cuenta el problema identificado por los clientes relacionado con la baja calidad del producto final del proceso de impregnación de postes para redes aéreas. En consecuencia, el objetivo de este artículo es identificar las causas de los defectos de calidad de los postes de servicio público en el proceso de impregnación en la UEB Planta de Impregnación. Para el control estadístico de los defectos de calidad se emplearon los gráficos de control, para atributos, específicamente los gráficos para el número de defectos por unidad y análisis de capacidad Poisson mediante la utilización del software Minitab 17.0, de igual forma se utilizó el Árbol de la Realidad Actual para la identificación de las causas raíces. A partir del diagnóstico realizado se identificaron postes que incumplen con los indicadores de calidad establecidos en las normas de trabajo; además de un incumplimiento de la demanda de estos productos, provocando la insatisfacción de los clientes. Se identifica a la vez que la causa raíz de los defectos lo constituyen las deficiencias en el proceso productivo.
Palabras clave: control estadístico; defectos de calidad; gráficos de control; proceso de impregnación; proceso productivo.
RESUMO
Este artigo resume os principais resultados do controle estatístico realizado para a produção de postes para redes aéreas na Unidade de Negócios de Impregnação de Base, localizada na Empresa Agroflorestal Macurije, na província de Pinar del Río. Para a realização da investigação, foi considerado o problema identificado pelos clientes relacionado com a baixa qualidade do produto final do processo de impregnação de pólos para redes aéreas. Consequentemente, o objectivo deste artigo é identificar as causas dos defeitos de qualidade dos pólos de serviço público no processo de impregnação na Fábrica de Impregnação da UEB. Para o controle estatístico dos defeitos de qualidade, foram usados gráficos de controle, para os atributos, especificamente os gráficos para o número de defeitos por unidade e a análise de capacidade de Poisson usando o software Minitab 17.0, da mesma forma que a Árvore de Realidade Atual foi usada para a identificação das causas raiz. A partir do diagnóstico feito, foram identificados postos que não cumprem os indicadores de qualidade estabelecidos nas regras de trabalho; além de não atender a demanda por esses produtos, causando insatisfação do cliente. Ao mesmo tempo, a causa raiz dos defeitos foi identificada como deficiências no processo de produção.
Palavras-chave: controle estatístico, defeitos de qualidade, cartas de controle, processo de impregnação, processo de produção.
INTRODUCTION
Wood has always occupied a prominent place among the various materials used by man due to a wide spectrum of important physical and mechanical characteristics. Its technology has been evolving and new products have emerged that have extended its field of application; therefore, at present, there is a growing search to know and improve the different processes that are linked to its industrialization, with the purpose of improving its use and exploitation Berrocal (2008).
It is for that reason that dissimilar methods are used that contributes to the preservation of the wood in order to prolong the useful life of the products elaborated from this material, in this respect Cruz de León (2010), states: "As preservation techniques have been perfected, wood has become more usable. It is currently used in very severe conditions, such as direct contact with the ground, immersed in water in difficult tropical climates. As a result, preserved wood is now considered to be a long-lasting material.
La Unidad Empresarial de Base (UEB) Planta de Impregnación belonging to the Agroforestry Enterprise Macurije in the province of Pinar del Río is responsible for producing and processing poles for aerial electricity and telecommunications networks. The documentary review shows a significant increase in complaints regarding the quality of the poles produced in this entity, as well as reports of their falling down due to hydro-meteorological phenomena or their incorrect installation; an exhaustive control of the quality of the raw materials, the quality of the process and the final product is not carried out.
Based on the above, the following problem was formulated to be solved: deficiencies in the production process of preserved poles destined for aerial networks, in the Macurije Planta de Impregnación, which cause low levels of quality in the final product. Consequently, the objective of this article is: to identify the causes of quality defects in public service poles in the impregnation process at the UEB Planta de Impregnación.
MATERIALS AND METHODS
The research is carried out in the `Macurije' Planta de Impregnación, the only one of its kind in the country, which started in 1962 and was installed with the purpose of impregnating poles for aerial networks and railway sleepers. In its beginning it used the creosote as persistent which has been historically the preservative by excellence for these products, nevertheless, after being proven its carcinogenic potential its use was prohibited in many countries including ours, reason why in 2009 a change of technology (due to the instability of the productions) and impregnation is made. The enterprise supplies annually 21 thousand poles to the National Electric Union and nine thousand to the Cuban Telecommunications Company (ETECSA), being these two companies its only clients due to the amount of products demanded. To guarantee its production, it has a total of 130 workers, a staff composed of engineers, technicians and workers.
The work focused on quality control, following the procedure proposed by Keil (2004), which consists of two stages:
In the Quality Control stage of the raw material, the moisture content of each pole was checked minutes before being introduced into the autoclave; for this purpose, a hygrometer was used; those measurements expressed whether the moisture content was acceptable, the range being between 20 and 30 %.
To examine the existence of knots and cracks, a check was made of each pole by rolling it on its support bases. The following were considered defects: knots with a diameter greater than 1,5 cm and cracks deeper than 2 cm according to the Quality Control for Wood Preservation.
For the treatment quality control, a complete record was made for each operation contained in the study sample, including the following data: number and date of operation, volume of wood and forest species processed, volume or quantity of preservative consumed by the wood, concentration and retention of the preservative and treatment conditions such as values and times of vacuum and pressure applied.
The results obtained in the treatment were verified by verifying the penetration and retention of preservative in the wood. These results were obtained from samples collected from fragments left over from the poles once the cut was made, verifying that all had the requested dimensions of 7,5 m or 9 m.
For penetration and retention studies, measurements were taken before and after impregnation. Penetration is understood to be the depth at which the preservative reaches the wood.
In the penetration test carried out on the poles, the change in color was observed based on the expressed impregnated diameters (total diameter and the diameter penetrated by the preservative). Regular Partial Penetration (RP), Partial Vascular Penetration (PV) and Null Penetration (NP) were taken as defects according to the classification proposed by the Board of the Cartagena Agreement for the Preservation of Wood (1988):
In soluble and hydrosoluble oil products such as the impregnant used in the plant (MOQ-OX-50), the term retention is used to describe the amount of preservative left in the wood and is obtained using the following formula (Equation 1) and (Equation 2).
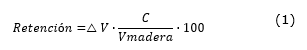
△V: Initial volume - Final volume of preservative in the tank;
C: solution concentration;
V wood: permeable wood volume.
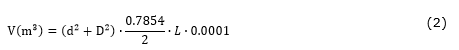
V(m³) = volume of round piece;
d = diameter of piece minor area in centimeters;
D = diameter of piece larger area in centimeters;
L = piece length in meters.
The retention of preservative was measured in each treatment and this information was filed in the treatment programme register. Retention values
(kg/m3): minimum (9,6), average (10,8) and maxim (12,0).
The embedment mark should be done taking into account the poles length. These marks should be done with an engraving print tool (pyrographier), but the enterprise doesn´t have this tool so the mark doesn't have required quality. For this purpose, some paints are used, but after a while these paints lose their characteristics and it is too difficult to read the data. It could be verified in some poles which are found in the enterprise wood cemetery since 2009 when the technology was changed.
The embedment mark should be done, using the following formula (Equation 3).
![]()
A revision of each pole was done and the embedment mark wasn´t, based on above saying it was defined as variables to measure:
Control graphics U (control graphics for defect number per unit) were used to represent defect number measures per unit.
The Poisson model was developed in order to represent error number in controlled units and also an analysis of the process capacity, taking into account these errors. For this purpose, it was taken some samples, obtaining from January to April 2019, where quality indicators were analyzed according to preliminary norma ramal: Preservación de la Madera de Cuba, which should be presented in impregnated poles, such us the knots and cracks numbers, bark presence, retention, penetration and embedment mark.
This study was done to 300 poles, beginning from 43 observations in different time during this period from January to April. In each observation, it was analyzed around 5 to 9 poles, and also added all defects in cases of non-fulfillment of some indicators.
A brainstorming with investigators and specialists was done with the objective to identify and synthesize the nature of these quality defects of final product. To select this expert group was established the following general requirements:
Taking into accounts the above criteria, it was calculated the index to be an expert people from the following formula (Equation 4).
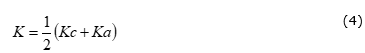
Where:
Kc: is the knowledge or information coefficiency that expert has about the problem upon
his/her own appreciation in scale from 0 to 10 and multiplied by 0, 1.
Ka: is argument or ground-work of expert criteria, determined as a result of the point's
sum, reached from a pattern table (Table 1).
Table 1. - Pattern for argument sources
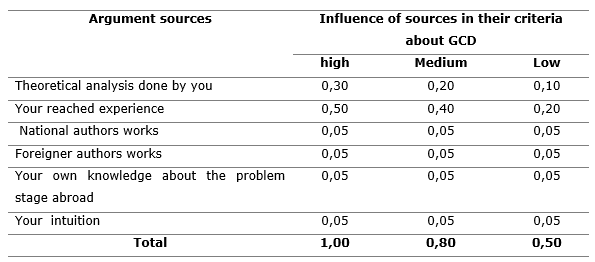
• K = 1 - high influence of all sources.
• K = 0,8 - medium influence of all sources.
• K = 0,5 - low influence of all sources.
People, who got equal index to 0, 8 or upper than 0, 8, were selected.
The specialist number determination was done through criteria based on binomial distribution of probability, for this purpose the formula 5 (Lao-León, 2017) was used (Equation 5).
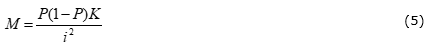
Where:
M: Specialist quantity;
i: wanted precision level;
P: Estimated proportion of specialist´s errors;
K: depend on the elected confidence level.
The K values were mentioned in the Table 6 as following (Table 2).
Table 2. - K values
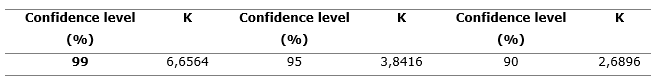
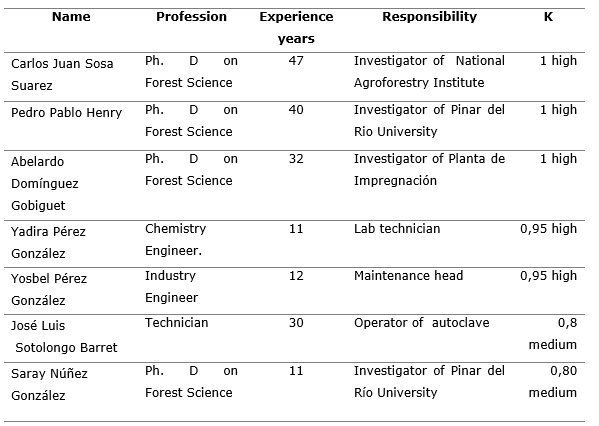
That is, the probability method was used and was assumed a binominal law of probability with a precision level of 10 %, an estimated proportion of errors (average) of 1 % and for a confidence level of 95 %, was obtained a necessity of 7 specialists. After specialists were selected, it was elaborated a final list (Table 3) and they were informed about their selection, ending this work of specialist selection.
Table 3. - Expert Group
To weigh the causes which influence in defects of quality, was used the Analysis Hierachy Process (AHP).
This process suggests doing the following steps:
a) To define decision criteria in a way of hierarchical objectives. The hierarchy process is structured in different levels: beginning to define the main objective of this process then is defined the intermediate levels (criteria and sub-criteria to evaluate) and finally, in the lowest level it is described the alternative to be compare.
b) To evaluate (to weigh) different criteria, sub-criteria and alternative taking into account their importance corresponding to each level. Quality and quantity could be compared, using informal judgment to obtain weighs and priorities. For quality criteria AHP technique uses simple comparison to determine weights and evaluate them. In this way the analyst can concentrate only in two criteria at the same time. The AHP technique is based on the supposition that the analyst can choose a comparison value easier than absolute values. Oral judgments were placed in punctuation scale (Table 4).
Table 4. - Evaluation of Saaty Scale
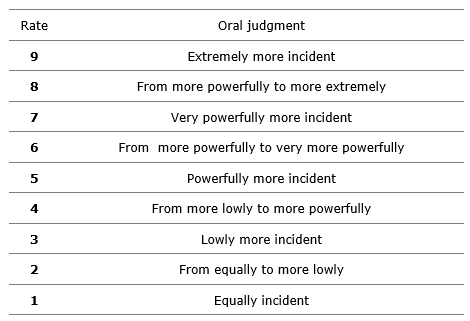
Source: (Saaty, 1994)
Later, in a judgment matrix a priority vector is calculated and used to weigh (compare) the matrix elements (Equation 6).
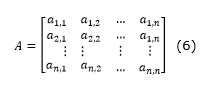
A is a paired comparison matrix of n causes, if ![]() is the incidence measure of row cause i,
when it is compared with the cause of column j. When is i = j the value
is the incidence measure of row cause i,
when it is compared with the cause of column j. When is i = j the value ![]() will be equal to one, because
it is compared the cause with itself (Berumen et al., 2007). It is fulfilled that:
i = j
will be equal to one, because
it is compared the cause with itself (Berumen et al., 2007). It is fulfilled that:
i = j
To obtain the weighs of causes, it is suggested programming by goal (Equation 7).
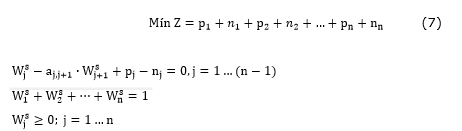
Where:
p: positive deviation of weighs;
n: negative deviation of weighs;
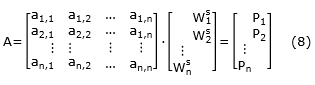
Multiplication of Saaty matrix by weighs vector ![]() It will be obtained the P values for each j cause from multiplication of Saaty matrix by
subjective weigh obtained (Equation 8).
It will be obtained the P values for each j cause from multiplication of Saaty matrix by
subjective weigh obtained (Equation 8).
Later it will be found dominant self-value, by the following formula (Equation 9).
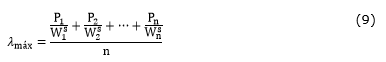
It should be fulfilled that![]() , so much it will be alike to the number of causes (n) more
consistent will be the value judgment elaborated.
, so much it will be alike to the number of causes (n) more
consistent will be the value judgment elaborated.
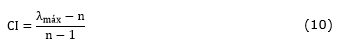
c) The AHP technique allows the analyst to evaluate the judgment congruence with inconsistency radius (IR). Before determining an inconsistency, it is necessary to estimate the consistency index (CI) of an x n matrix of judgments, where CI is defined by (Equation 10).
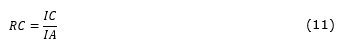
Then, it will be proceeded to calculate the relation of consistency (RC) between ratio of consistency (IC) of A and random IC by the following formula (Equation 11).
It will be considered that the consistency of group, which takes parts in the decision process, is acceptable when RC < 0,10 (Table 5).
Table 5. - CIA Values according to criteria number
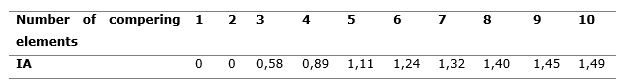
Source: (Berumen, 2007).
d) To rank the alternatives and to take concerning decisions. For each alternative (options to rank), the choice level (rank) is calculated about in scale between 0,0000 1,000, obtaining as a result hierarchical alternatives according to decision criteria evaluated see details in (Saaty, 1994).
The Current Reality Tree is used to explain the inter-dependence relation presented among deficiencies and their causes. This method is formed by listing specific problems observed in a process or connecting to it, and developing a chain of causes and effects, which link problems with powerful sources. In this way it is identified the problem or root conflict which originates other conflicts as no-wanted effects.
According to Mozart-da Silva, Silva y Deus (2014) in order to The Current Reality Tree (ARA) is compact and suitable to the problem it is necessary some considerations, which are used to validate and to conceive the ARA, as it is presented on Table 6 which represents the entities flux.
Table 6. - The entities flux inside The Current Reality Tree (ARA)
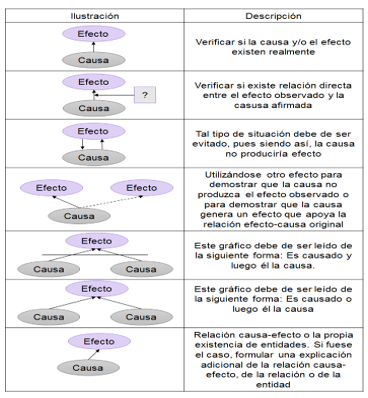
Source: Mozart-da Silva, Silva y Deus (2014).
RESULTS AND DISCUSION
In the Figure 1 it is shown the first 29 measures, corresponding to 203 poles, which were used to fix the limits of the process. It is identified that all points are located inside the control border, that´s why it can be deduced that the process is under control and the calculated limits can be used to monitor the process (Mallor, 2019).
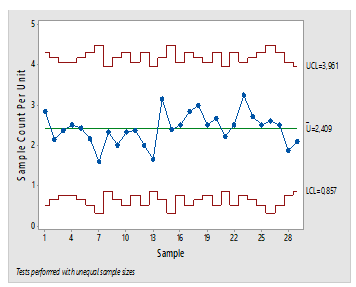
Figure 1. - Graphic U of defects
From Figure 2, where 43 observations are represented for a whole of 300 poles, it can be observed a growing tendency in the last points represented. These points correspond to understanding samples of 30 to 43 for a whole of 97 poles.
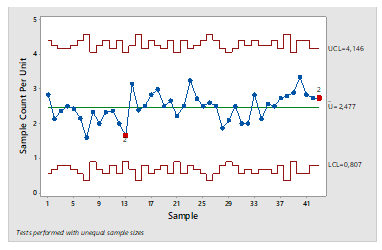
Figure 2. - Gráfico U de defectos
From the points increasing between samples 29 and 43 in Figure 2, it was represented each data group to observe its behavior and to explain the increase (Figure 3).
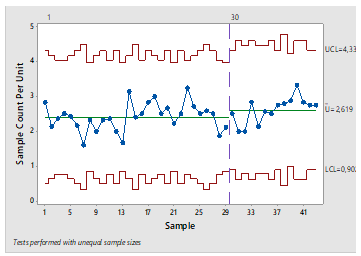
Figure 3. - Gráfico U de defectos para C3
In the Figure graphic shows an average increase of process defects, it can be observed how limits have increased in relation to the first 29 samples. This average increase of defects is due to provider change of raw materials. The poles from Guanahacabibes Forest Reservation come to the Planta de Impregnación with indicators, which don´t fulfill the quality standard according to the norm for this purpose. It is demonstrated that the row materials quality from Macurije Agroforest Enterprise is superior and that is main cause of variation.
Control graphics U showed in the Figures 1, 2, 3; despite the results seem that the process is under statistical control, they are not the final results, which allow the customers to take decisions about the quality of final product. To support customers' decision criteria, it was done analysis of process capacity, which is shown in the Figure 4.
The analysis of poisson capacity, showed in Figure 4, provides a capacity report, created from the Poisson distribution. In this way the graphic U is integrated to verify the process is under control while is doing the capacity analysis, the graphic with accumulated average of DPU (defects per unit) to verify that there are enough samples to obtain stable estimator of average. The histogram of DPU shows the distribution of defects per inspection unit among different samples and the graphic of defects rate (when the simple size is not constant) allows to verify the supposition of the DPU value is not influenced by the simple size.
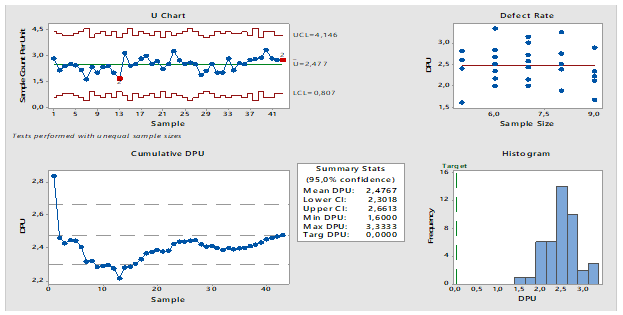
Figure 4. - Analysis of Poison capacity for defects
This analysis showed that 2, 477 defects as average per pole are producing in the process. These defects are in the rank of 2,477-2, 6613, showing non-fulfillment with customer's specifications, because ETECSA or Electric Company does not accept defects in poles, which do not fulfill quality indicator.
Verification of causes
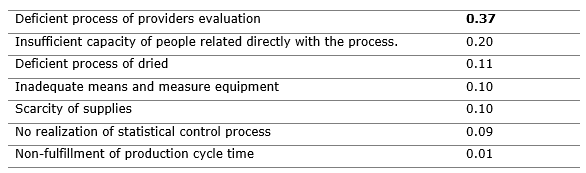
As result of a review and evaluation of all causes, the expert group summarized and weighed them as following (Table 7).
Table 7. - Results: (hierarchy software output)
Determination of root causes
Once it is weighed every cause given by the expert group, it was done The Current Reality Tree (ARA) as it is shown in Figure 5 to determine their interrelation.
From this analysis it was resulted that the root cause associated to the appearance of quality defects and finally the nonfulfillment of established requirements by the customers are the deficiencies of the own impregnate process. This is a non-resulted problem yet and it affects directly the indicators of process and customer's satisfaction. Emphasizing as more influent causes the deficient process of provider evaluation, insufficient personal capacity and deficient process of dried. This technique coincides with the results obtained from Analysis Hierarchical Process (AHP) (Figure 5).
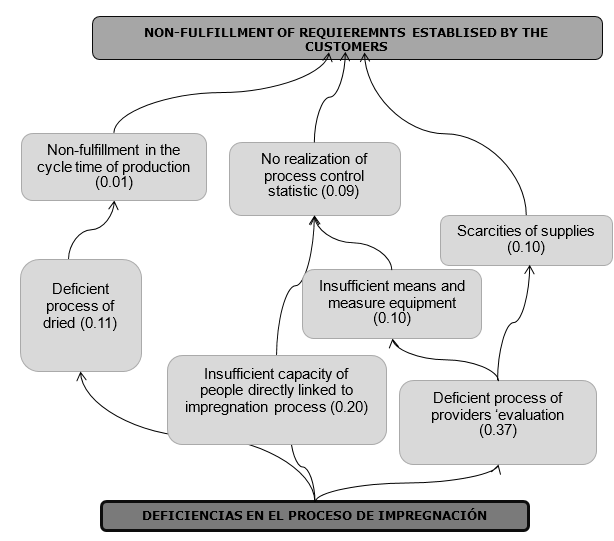
Figure 5. - The Current Reality Tree (ARA) of deficiencies in preservation process in la Planta de Impregnación de Macurije
In the Planta de Impregnación Macurije, there is not carried out a severity quality. It is produced as average 2,477 defects per pole, emphasizing as more significant defects absence of embedment mark and preserving penetration.
It was identified deficiencies in preserving process of public service poles in la Planta de Impregnación, which limit the quality of final product, it is determined as more influent causes the deficient process of provider evaluation, insufficient people training and deficient dried process.
REFERENCES
BERROCAL JIMÉNEZ, A., 2008. Sistemas de preservación de madera para la construcción. Kurú: Revista Forestal [en línea], vol. 5, no. 15.
BERUMEN, S. A. 2007. La utilidad de los métodos de decisión multicriterio (como el AHP) en el entorno de competitividad creciente. (Cuadernos de Administración ed.).
JUNTA DEL ACUERDO DE CARTAGENA, 1988. Manual del Grupo Andino para la preservación de maderas [en línea]. Perú: Proyecto Subregional de Promoción Industrial de la madera para Construcción. Disponible en: https://books.google.com.cu/books/about/Manual_del_Grupo_Andino_para_la_preserva.html?id=DQ12xgEACAAJ&redir_esc=y.
KEIL, G.D., 2004. Biodegradación y preservación de la madera [en línea]. 2004. S.l.: Universidad Nacional del Comahue. Asentamiento Universitario San Martín de los Andes. Disponible en: https://docplayer.es/51843956-Biodegradacion-y-preservacion-de-la-madera-2-al-7-de-agosto-de-2004.html.
LAO LEÓN, Y.O., MARRERO DELGADO, F., PÉREZ PRAVIA, M.C. y GONZÁLEZ RICARDO, J.J., 2017. Identificación de Restricciones Físicas en el Sistema Logístico de Empresas Comercializadoras en Holguín, Cuba. Visión de Futuro. Revista científica, vol. 21, no. 14, pp. 136-150. ISSN 1668 8708. Disponible en: http://www.scielo.org.ar/scielo.php?script=sci_abstract&pid=S1668-87082017000100004
MALLOR, F., RAIOLA, M., VILA, C.S., ÖRLÜ, R., DISCETTI, S. y IANIRO, A., 2019. Modal decomposition of flow fields and convective heat transfer maps: An application to wall-proximity square ribs. Experimental Thermal and Fluid Science, vol. 102, pp. 517-527. Disponible en: https://www.sciencedirect.com/science/article/pii/S0894177718312792
RAFAEL MOZART SILVA, L. T. 2014. Uma Análice das Contribuiçoes da Logística Reversa de Pós-Venda nas Estratégias da Cadeia de Suprimentos a través dos conceitos da Teoria das Restriçoes (TOC). Journal of Engineering and TechnologyInnovation. Disponible en: http://www.revistaseletronicas.fmu.br/index.php/inovae/article/view/385
SAATY, T. L. 1994. Fundamentals of Decision Making. RSW Publications.
Conflict of interests:
The authors declare not to have any interest conflicts.
Authors' contribution:
The authors have participated in the writing of the work and analysis of the documents
![]()
This work is licensed under a Creative Commons Attribution-NonCommercial 4.0 International license.
Copyright (c) 2020 Oxandra Roca Rivera, Saray Núñez
González,
Yosvani Orlando Lao León